


Updated at: 2022-12-09 03:49:50
Click KAI > Business Panorama to enter the Business Panorama page, where you can customize visual view by selecting the basic shapes or chart component to be drawn from the graph list to monitor the running status of the services. The specific steps are as follows:
1. In the Business Panorama page, click New to enter the new blank canvas page;
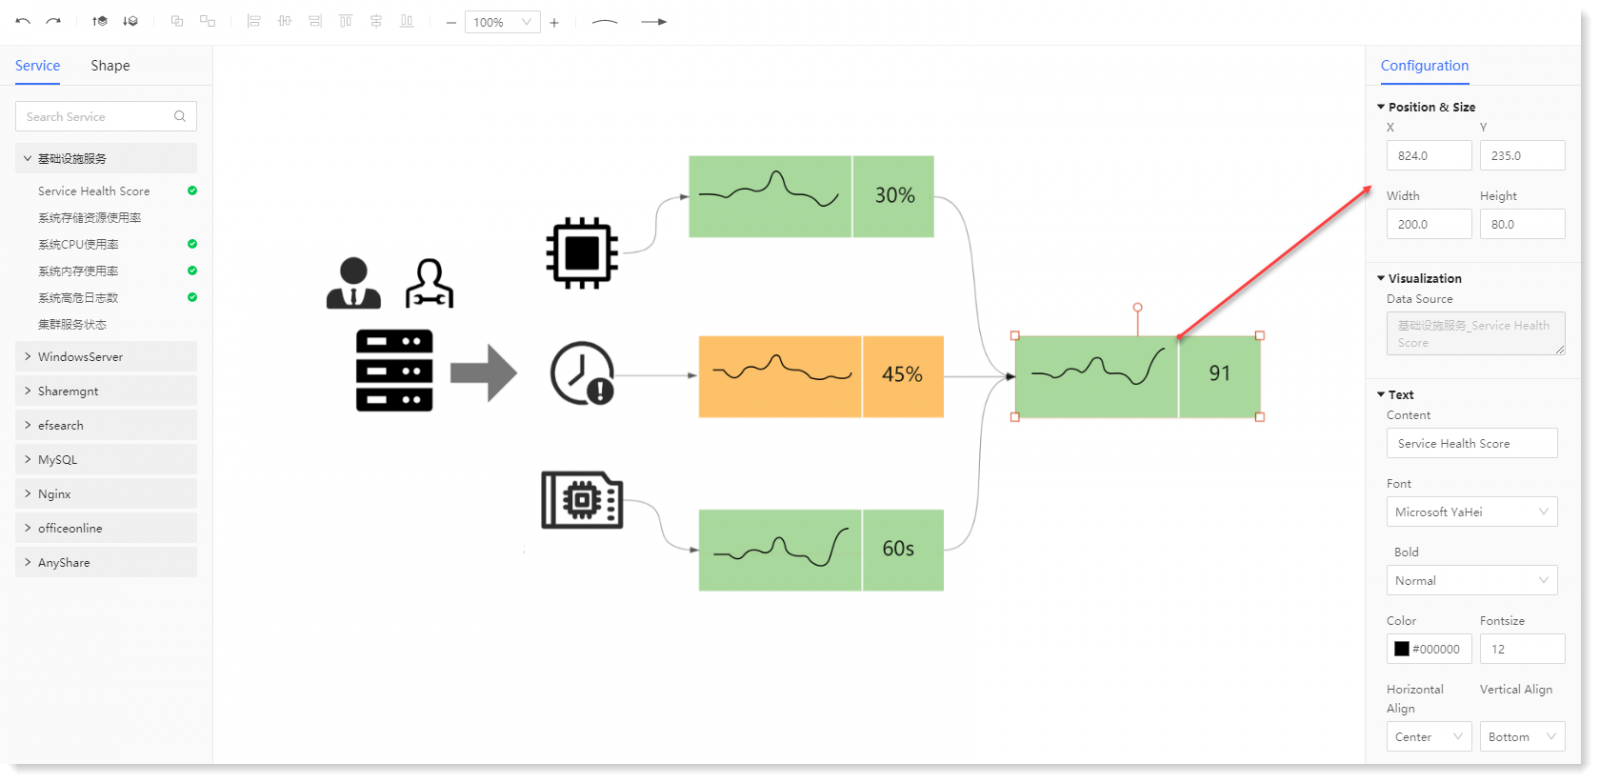
2. In the Graph list on the left, you can select the required shapes and widgets and drag and drop them onto the drawing canvas. At this time, the configuration window of the graph is displayed on the right, and the graph parameters can be configured in the configuration window:
_5.png) Note: The data displayed in the trend graph will be refreshed synchronously according to the time period selected by the time selector in the upper right corner of the interface.
Note: The data displayed in the trend graph will be refreshed synchronously according to the time period selected by the time selector in the upper right corner of the interface.
3. Click Save to complete the business panorama configuration.
1. In the Business Panorama page, click New to enter the new blank canvas page;
2. In the Graph list on the left, you can select the required shapes and widgets and drag and drop them onto the drawing canvas. At this time, the configuration window of the graph is displayed on the right, and the graph parameters can be configured in the configuration window:
Note: The data displayed in the trend graph will be refreshed synchronously according to the time period selected by the time selector in the upper right corner of the interface.3. Click Save to complete the business panorama configuration.
< Previous:
Next: >