


Updated at: 2022-12-09 03:49:50
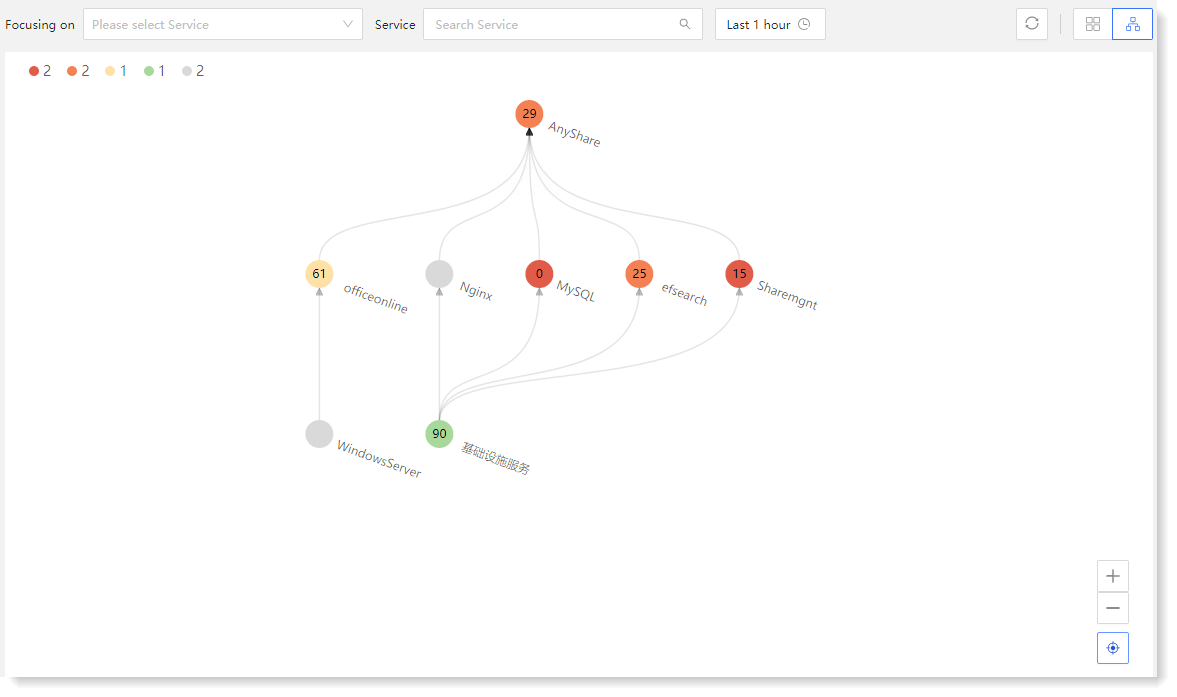
In the Service Analyzer tile view, click the  icon in the upper right corner to switch the view mode. The tree view provides a more intuitive view of the health of the service and the dependency relation between services, and you can drill down to see the KPIs associated with the service and the running status of the entity.
The nodes in the tree view represent individual services, the color indicates the current severity of the service, and the lines between the nodes represent the dependency relation between the services, as follows:
 • Drill-down of service/KPI
For abnormal service or KPI score and severity, you can click on the service node to drill down to see if the KPI or entity status is normal, locate the specific anomaly, and drill down for the root cause, as follows:
 • Service filter display
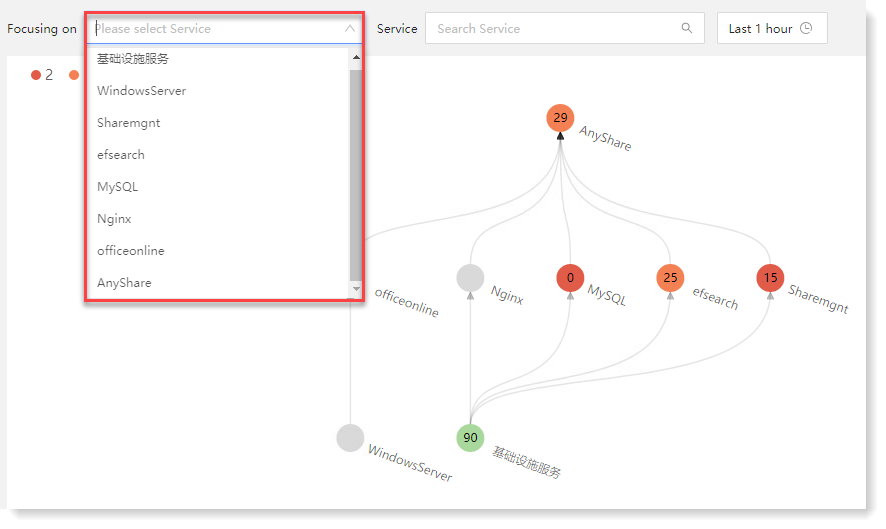
Choose the service in Focusing on service dropdown list which could be automatically showed in tree view, while right side displays KPI auxiliary panel that can be drilled down to view correlated KPI details.
You can display services through the service name filter. You can view the service running status in specified time range through TimePicker, as follows:
icon in the upper right corner to switch the view mode. The tree view provides a more intuitive view of the health of the service and the dependency relation between services, and you can drill down to see the KPIs associated with the service and the running status of the entity.The nodes in the tree view represent individual services, the color indicates the current severity of the service, and the lines between the nodes represent the dependency relation between the services, as follows:
• Drill-down of service/KPIFor abnormal service or KPI score and severity, you can click on the service node to drill down to see if the KPI or entity status is normal, locate the specific anomaly, and drill down for the root cause, as follows:
• Service filter displayChoose the service in Focusing on service dropdown list which could be automatically showed in tree view, while right side displays KPI auxiliary panel that can be drilled down to view correlated KPI details.
You can display services through the service name filter. You can view the service running status in specified time range through TimePicker, as follows:
< Previous:
Next: >