


Updated at: 2022-12-09 03:49:50
Click State Monitoring, you can customize Trigger Condition, color, and priority of multiple monitoring states, so that IT administrator can keep track of IT operation state and prioritize high-risk events. State Monitoring can be accessed in Search, to provide time clue for troubleshooting. The specific steps are as follows:
1. Click Visualization > State Monitoring to select data sources. You can filter out the required data sources by selecting Log Group or Saved Search;
2. Make state monitoring visualization editing, and configure parameters as follows:
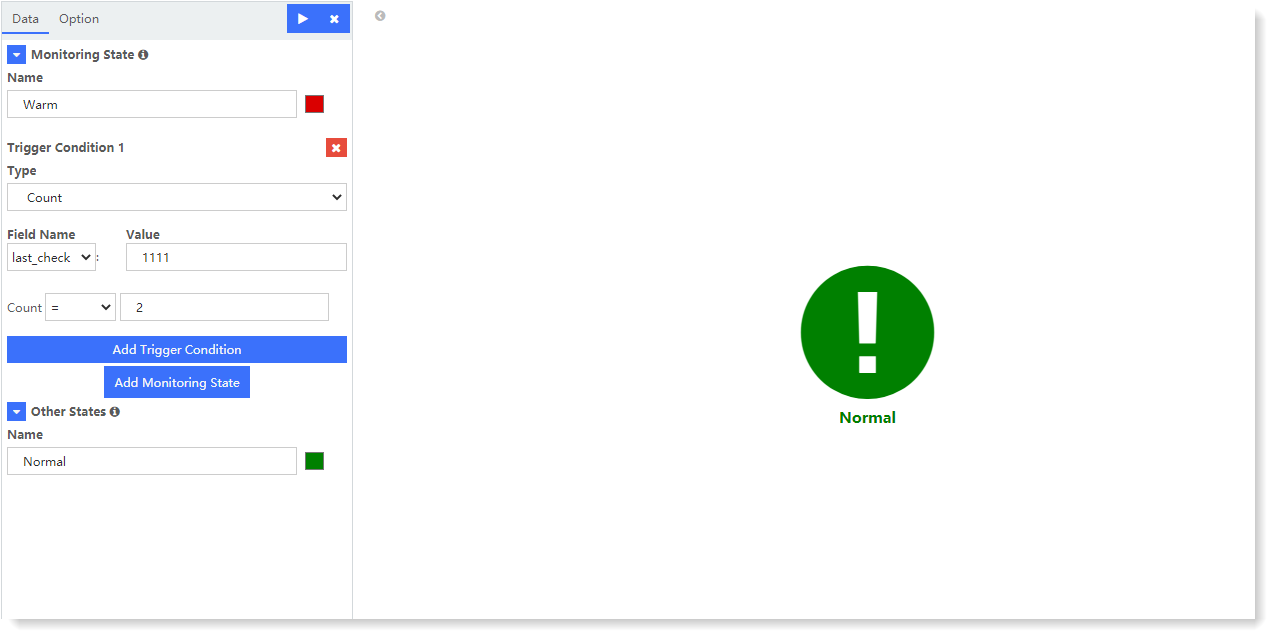
► Configure Monitoring State:
• Name: Set the display name and color of state;
• Trigger Condition: It supports adding one or more trigger conditions to the monitoring state;_15.png) Note:
Note:
1. The priority for multiple settings of State Monitoring is from top to bottom by default. If multiple monitoring states are triggered, the higher-priority monitoring state and its color are displayed by default. For priority adjustment method, please refer to the section Generic Function of View ;
2. All trigger conditions are in OR logical relationship.
► Other States: Set the name and color of the states except the monitoring state.
3. After completing the above configuration, click the button at the top left to check the visual view on the right, as follows:
The above example is for the fileName field. When its value is equal to apache_error. txt and the number of occurrences is greater than 1, the monitoring state will be displayed as medium-risk orange, and the other states will be displayed as normal green.
4. Click Save to complete the current visual view creation.
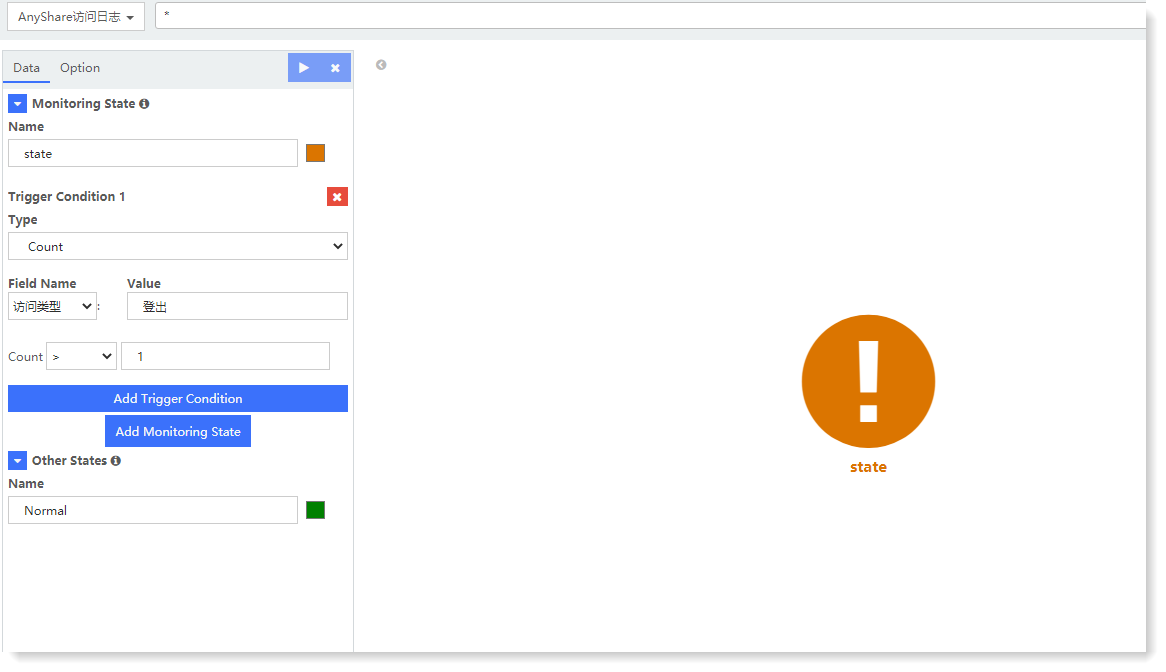
1. Click Visualization > State Monitoring to select data sources. You can filter out the required data sources by selecting Log Group or Saved Search;
2. Make state monitoring visualization editing, and configure parameters as follows:
► Configure Monitoring State:
• Name: Set the display name and color of state;
• Trigger Condition: It supports adding one or more trigger conditions to the monitoring state;
• Type: It is the counting method by default;
• Field Name / Value: Set aggregation field and field value;
• Count: It includes >, =, <, in, and not in; you can add value, and set the trigger condition of field value count.
• Field Name / Value: Set aggregation field and field value;
• Count: It includes >, =, <, in, and not in; you can add value, and set the trigger condition of field value count.
Note:1. The priority for multiple settings of State Monitoring is from top to bottom by default. If multiple monitoring states are triggered, the higher-priority monitoring state and its color are displayed by default. For priority adjustment method, please refer to the section Generic Function of View ;
2. All trigger conditions are in OR logical relationship.
► Other States: Set the name and color of the states except the monitoring state.
3. After completing the above configuration, click the
button at the top left to check the visual view on the right, as follows: The above example is for the fileName field. When its value is equal to apache_error. txt and the number of occurrences is greater than 1, the monitoring state will be displayed as medium-risk orange, and the other states will be displayed as normal green.
4. Click Save to complete the current visual view creation.
< Previous:
Next: >