


Updated at: 2022-12-09 03:49:50
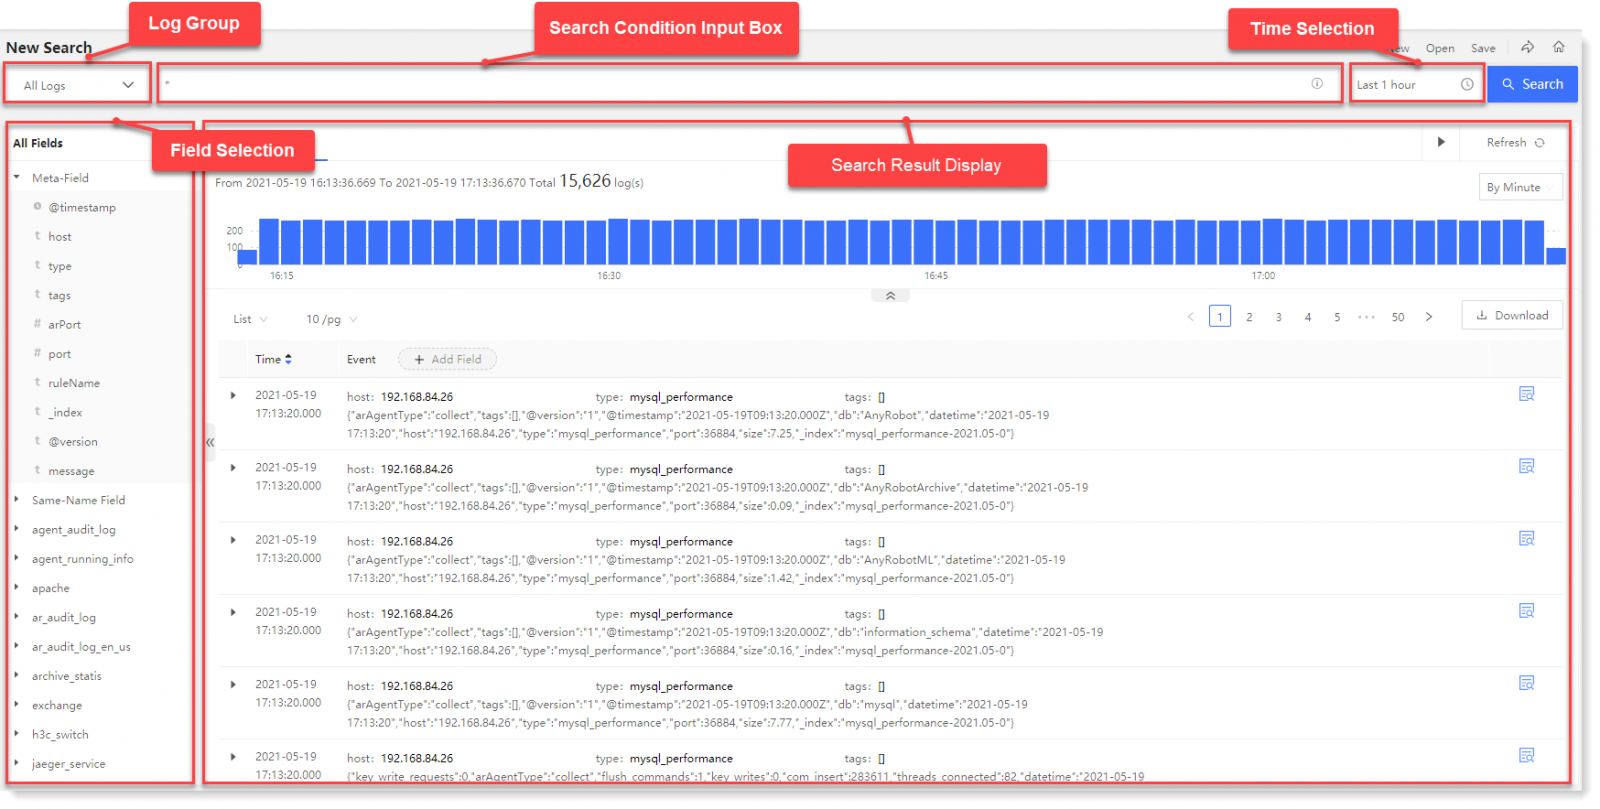
Click Search to go to the search homepage, click the  icon to make data search, as follows:
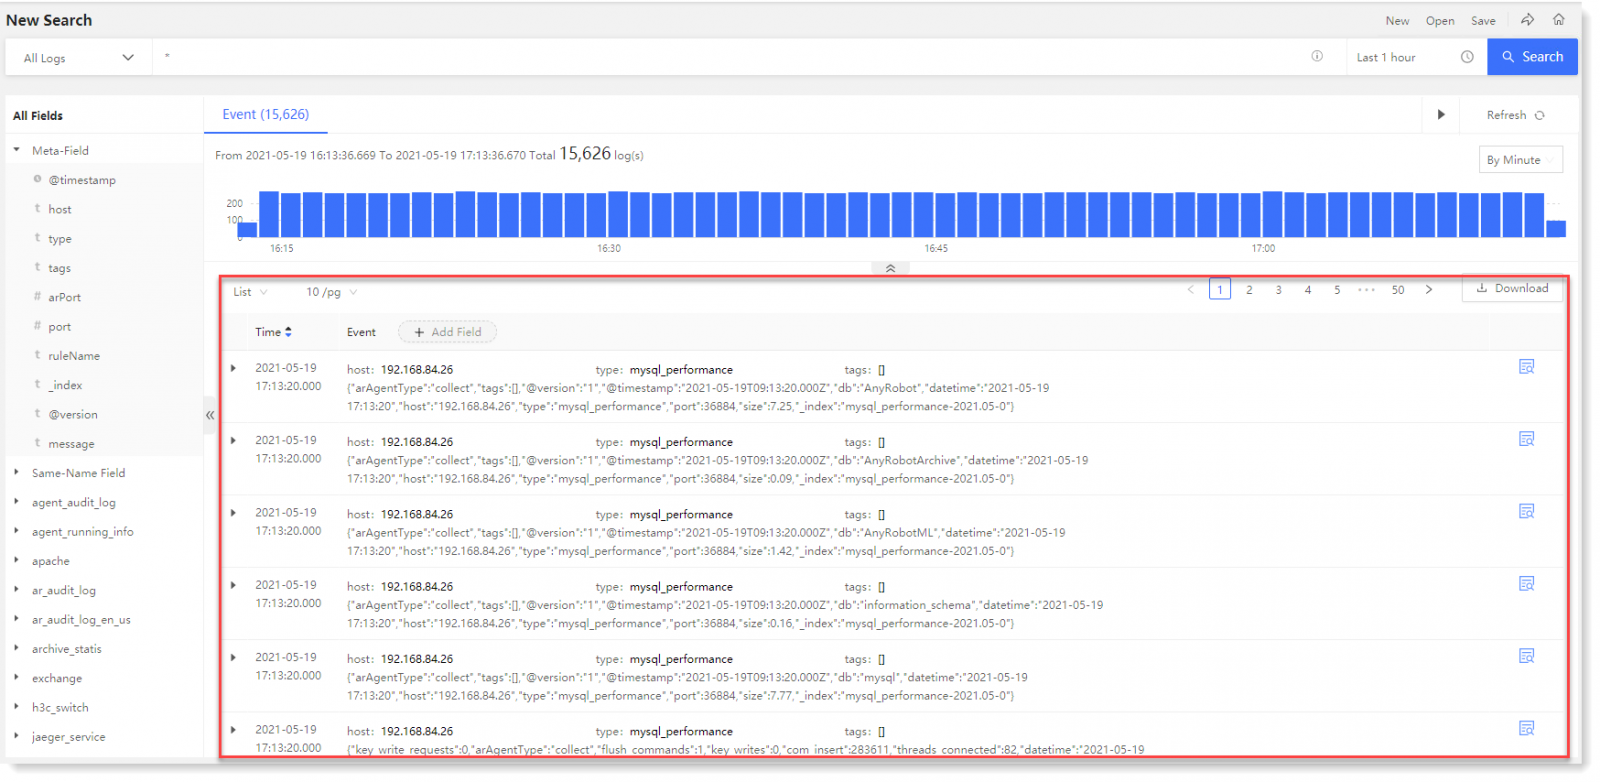
► Statistical Histogram: The statistical histogram in the search result area, including: the time distribution of events and the total number of events.
In the statistical histogram, you can view the time distribution trend of log events and the total number of all events over the time period, and click the icon to fold the statistical view.
• You can click on single or multiple buckets to filter the data for the selected time period;
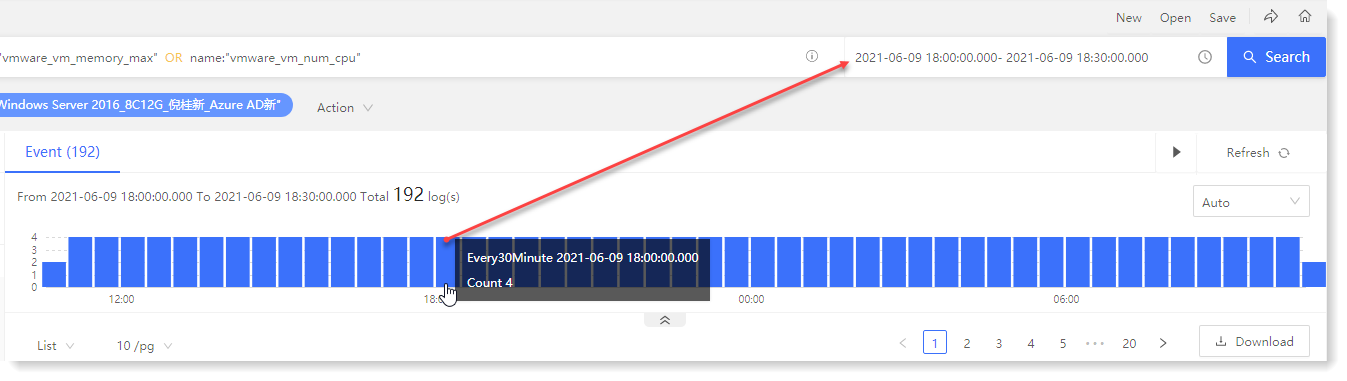
• Hover over a single bucket to view the bucket aggregation time period and event statistics values, as follows:
• The statistical histogram is automatically divided into intervals by default according to event data, which supports manual selection: display data by millisecond, by second, by minute, by hour, by day, by week, by month, by year, and for manual selection out of the range, the interval will be automatically adjusted according to the best solution.
► Event List: You can view the list of search result events that match the search condition. The log event list includes timestamp, source host, log type, log tag, parsed field type, field name, field value, and field action, as follows:
_15.png) Note: In the event list, you can View Context and View Associated File .
Note: In the event list, you can View Context and View Associated File .
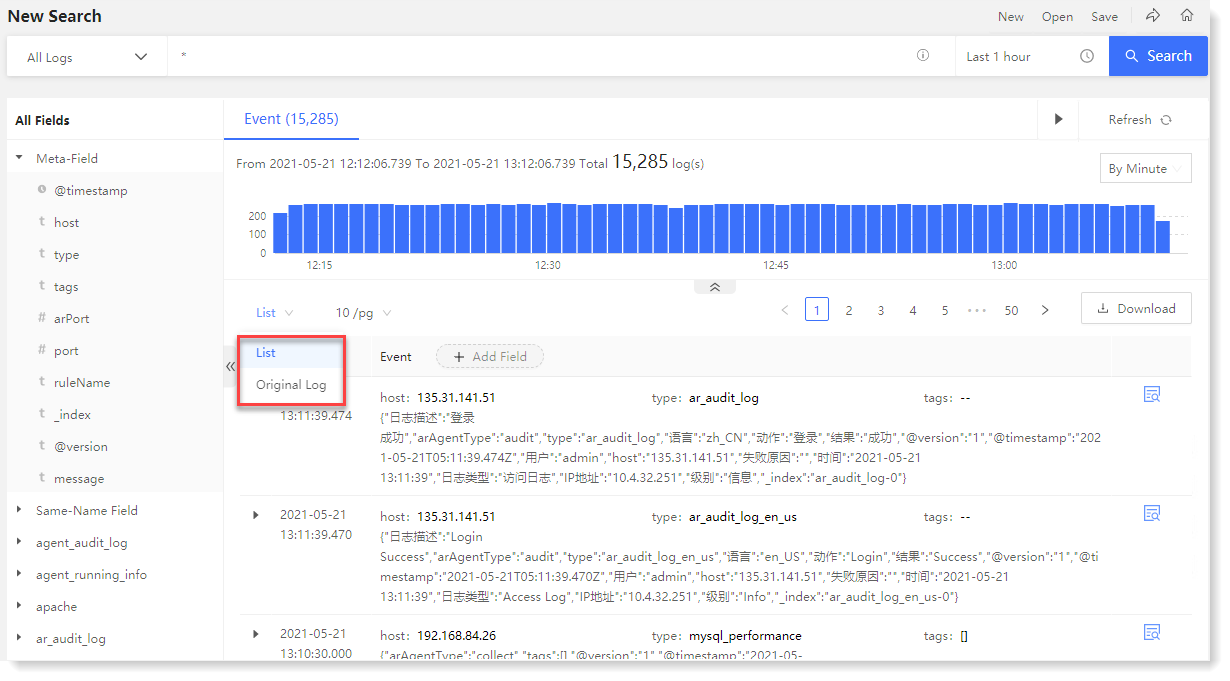
• You can view the event details in the event list, and switch the event display mode between List and Original Log, as follows:
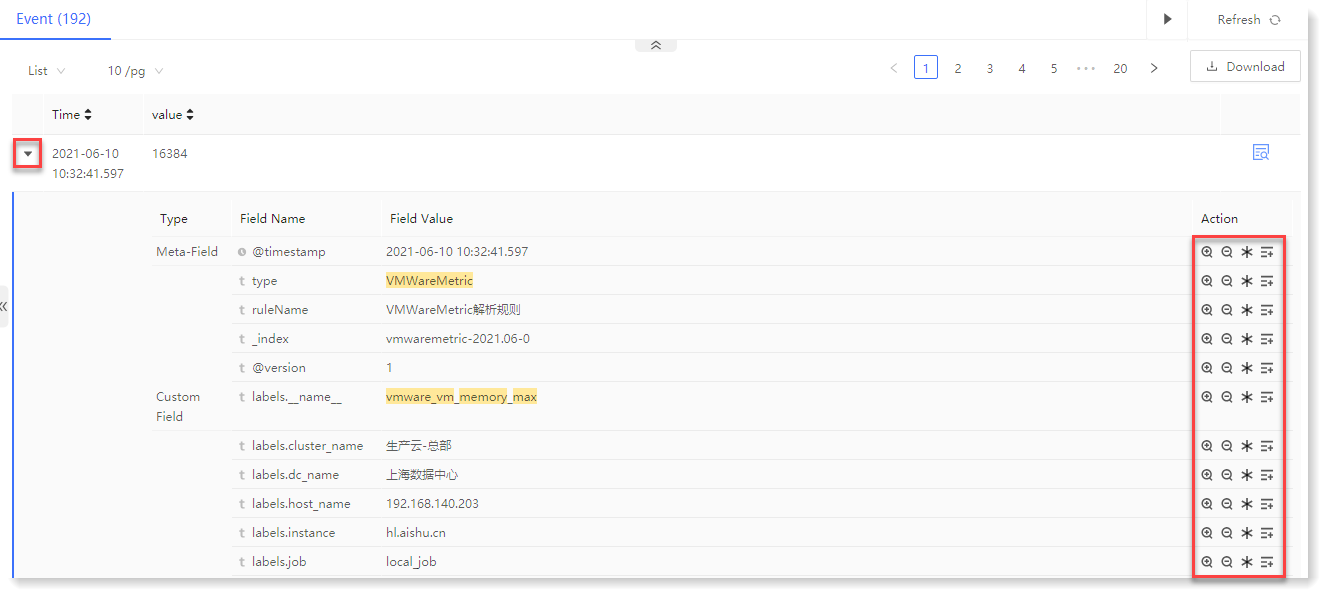
• Click the icon on the left side to unfold event, and you can view the list of parsed fields, including: field type, field name, field value, and actions (direct/reverse selection of field value, saved field value, adding field to list).
icon to make data search, as follows:► Statistical Histogram: The statistical histogram in the search result area, including: the time distribution of events and the total number of events.
In the statistical histogram, you can view the time distribution trend of log events and the total number of all events over the time period, and click the
icon to fold the statistical view.• You can click on single or multiple buckets to filter the data for the selected time period;
• Hover over a single bucket to view the bucket aggregation time period and event statistics values, as follows:
• The statistical histogram is automatically divided into intervals by default according to event data, which supports manual selection: display data by millisecond, by second, by minute, by hour, by day, by week, by month, by year, and for manual selection out of the range, the interval will be automatically adjusted according to the best solution.
► Event List: You can view the list of search result events that match the search condition. The log event list includes timestamp, source host, log type, log tag, parsed field type, field name, field value, and field action, as follows:
Note: In the event list, you can View Context and View Associated File .• You can view the event details in the event list, and switch the event display mode between List and Original Log, as follows:
• Click the
icon on the left side to unfold event, and you can view the list of parsed fields, including: field type, field name, field value, and actions (direct/reverse selection of field value, saved field value, adding field to list).
< Previous:
Next: >