


Updated at: 2022-12-09 03:49:50
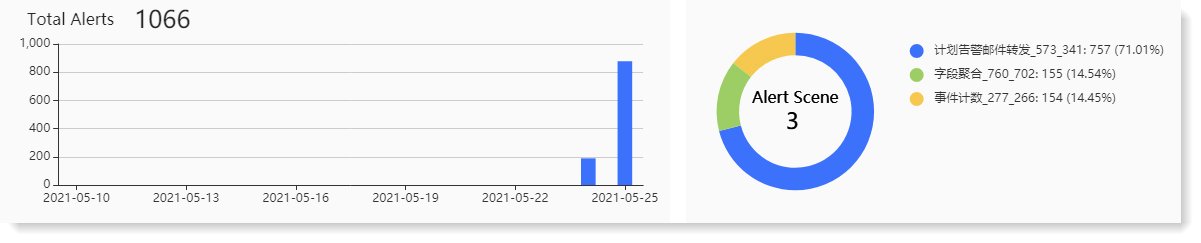
► Alert statistics chart: It visualizes alert statistics, including alert timing diagram and alert scene ratio:
• Alert timing diagram: It shows the total number of alerts and the distribution of alerts over time;
• Alert scene ratio: It shows the number of alert scenes and the number and ratio of alerts per alert scene.
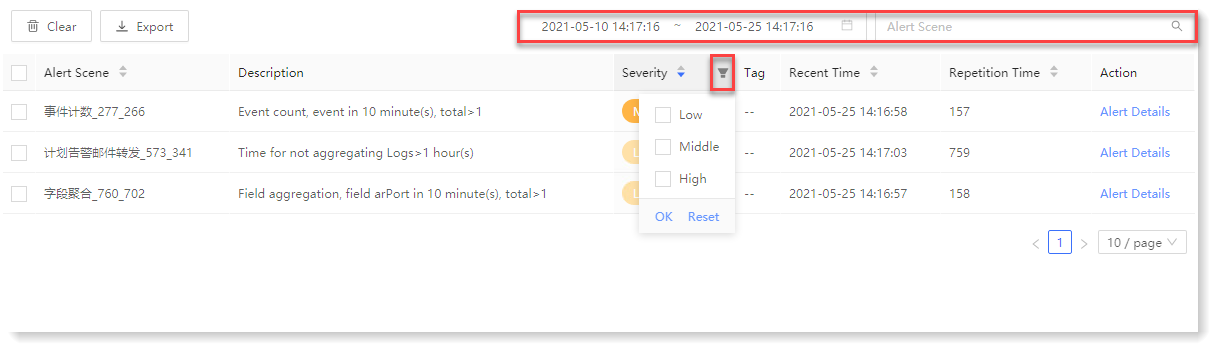
► Alert record list: It displays all the alert record information. You can quickly find the alert record information through TimePicker, Keyword and Severity:
• Alert timing diagram: It shows the total number of alerts and the distribution of alerts over time;
• Alert scene ratio: It shows the number of alert scenes and the number and ratio of alerts per alert scene.
► Alert record list: It displays all the alert record information. You can quickly find the alert record information through TimePicker, Keyword and Severity:
< Previous:
Next: >