


Updated at: 2022-12-09 03:49:50
It is to locate geographic locations by geographic coordinates. This is implemented by Geohash aggregation, which can group multiple sets of coordinates into a set. The presentation of the world map requires the geo_point field with longitude and latitude coordinates resolved by the IP address. The specific steps are as follows:
1. Click Visualization > China Map to select data sources. You can filter out the required data sources by selecting Log Group or Saved Search;
2. Make China map visualization editing, and configure parameters as follows:
1) Configure the aggregation type of field values:
• Aggregation: Select the aggregation type for the set value: Count (default), Avg, Sum, Median, Min, Max, Unique Count, Top N;
• Conversion of Units: Set the conversion from original units to target units, and you can enable/disable this function;
2) Configure location coordinates:
• Aggregation: Geohash by default;
• Field: Bucket aggregation is based on the field geoip.location by default .
3. After completing the above configuration, click the button at the top left to check the visual view on the right. Hover over a data point, and a floating window will display Field Aggregation Value, Longitude and Latitude, as follows:
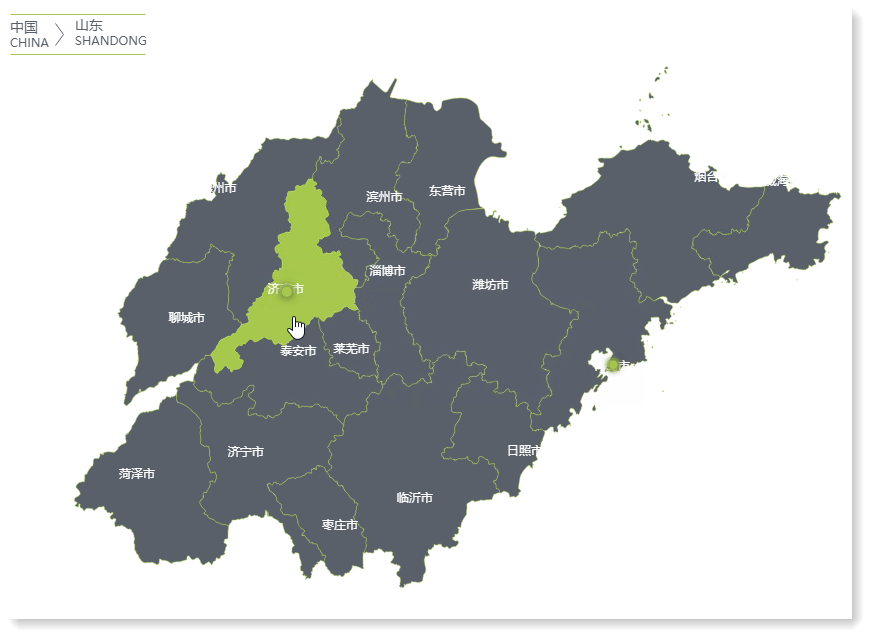
 You can zoom China Map by rolling the mouse wheel. Click on any one provincial administrative region to drill down to the corresponding provincial region, as follows:
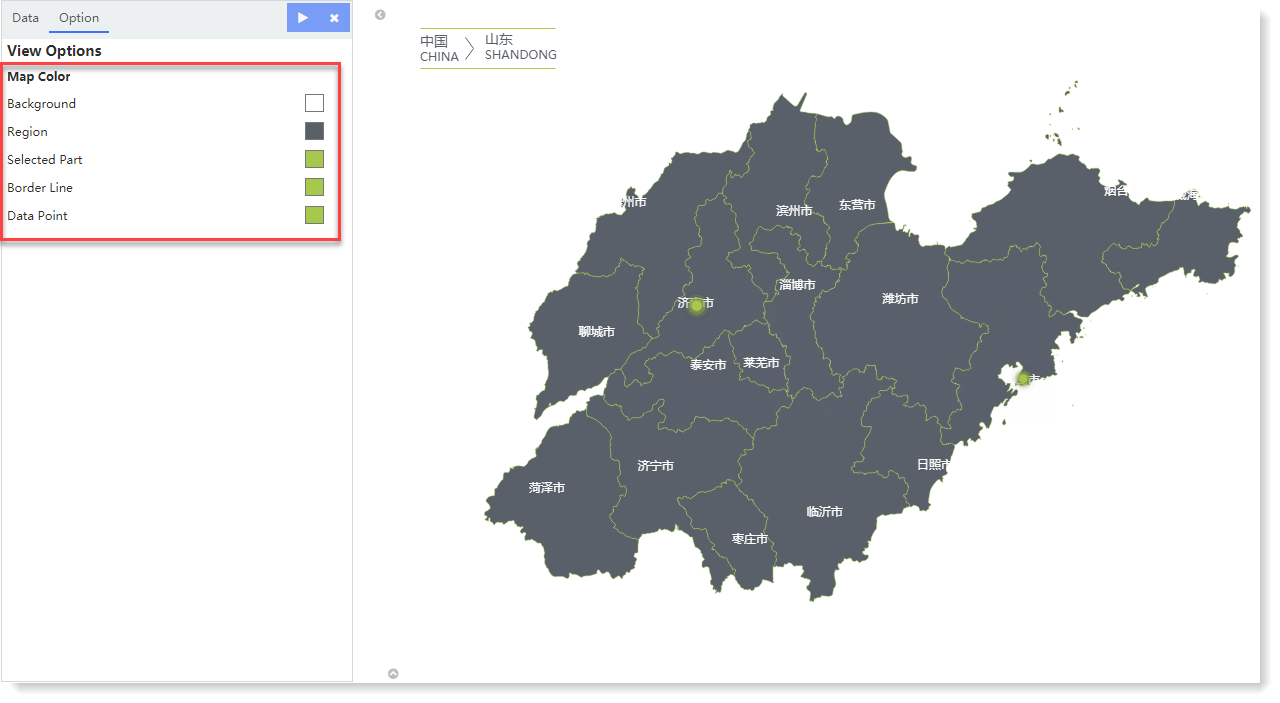
4. For the generated chart, you can also switch to Option and set the Map Color, as follows:
 5. Click Save to complete the current visual view creation.
1. Click Visualization > China Map to select data sources. You can filter out the required data sources by selecting Log Group or Saved Search;
2. Make China map visualization editing, and configure parameters as follows:
1) Configure the aggregation type of field values:
• Aggregation: Select the aggregation type for the set value: Count (default), Avg, Sum, Median, Min, Max, Unique Count, Top N;
• Conversion of Units: Set the conversion from original units to target units, and you can enable/disable this function;
2) Configure location coordinates:
• Aggregation: Geohash by default;
• Field: Bucket aggregation is based on the field geoip.location by default .
3. After completing the above configuration, click the
button at the top left to check the visual view on the right. Hover over a data point, and a floating window will display Field Aggregation Value, Longitude and Latitude, as follows: You can zoom China Map by rolling the mouse wheel. Click on any one provincial administrative region to drill down to the corresponding provincial region, as follows:4. For the generated chart, you can also switch to Option and set the Map Color, as follows:
5. Click Save to complete the current visual view creation.
< Previous:
Next: >