


Updated at: 2022-12-09 03:49:50
The drop-down list can meet personalized filtering requirements of users and support custom drop-down list options and combinations. The specific steps are as follows:
1. Click Visualization > Dropdown List to select data sources. You can filter out the required data sources by selecting Log Group or Saved Search;
2. Make dropdown list visualization editing, and configure parameters as follows:
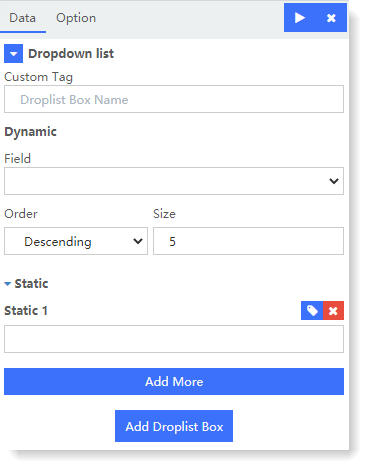
• Custom Tag: The custom name for Dropdown List; if not filled, the default is the name of selected fields;
• Dynamic: to modify the static option name.
.png) Note: You can add multiple Dropdown Lists, and each one has only one Dynamic option, but there can be multiple Static options.
Note: You can add multiple Dropdown Lists, and each one has only one Dynamic option, but there can be multiple Static options.
3. After completing the above configuration, click the button at the top left to check the visual view on the right, as follows:

4. For the generated chart, you can also switch to Option and set the following parameters:
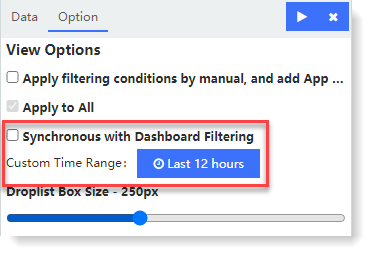
• Apply filter conditions by manual, and Add App Button: Not ticked by default, click the Dropdown List option to add it directly to the search box as a filter condition, for global use.
• Synchronous with Dashboard Filtering: Ticked by default, to synchronize with the current search time. You may not tick it as needed to customize the time of the Dropdown List option.
5. Click Save to complete the current visual view creation.
1. Click Visualization > Dropdown List to select data sources. You can filter out the required data sources by selecting Log Group or Saved Search;
2. Make dropdown list visualization editing, and configure parameters as follows:
• Custom Tag: The custom name for Dropdown List; if not filled, the default is the name of selected fields;
• Dynamic:
• Field: Set the fields to be aggregated;
• Order: Set the sorting method of drop-down list field values in order, and the default order is in descending order to take the values of the top 5 fields.
• Static: Non-mandatory item, you can customize the value of required field values, and add more than one. Click • Order: Set the sorting method of drop-down list field values in order, and the default order is in descending order to take the values of the top 5 fields.
to modify the static option name.Note: You can add multiple Dropdown Lists, and each one has only one Dynamic option, but there can be multiple Static options.3. After completing the above configuration, click the
button at the top left to check the visual view on the right, as follows: 4. For the generated chart, you can also switch to Option and set the following parameters:
• Apply filter conditions by manual, and Add App Button: Not ticked by default, click the Dropdown List option to add it directly to the search box as a filter condition, for global use.
• Synchronous with Dashboard Filtering: Ticked by default, to synchronize with the current search time. You may not tick it as needed to customize the time of the Dropdown List option.
5. Click Save to complete the current visual view creation.
< Previous:
Next: >