


Updated at: 2022-12-09 03:49:50
The generic function of view mainly lists the generic configuration parameters in various types of visual view configurations, including: aggregation method control, unit conversion, view option configuration, hiding/displaying configuration, parameter/legend identification, and viewing details of view aggregation values.
► Aggregation method control: When configuring multiple metrics or bucket aggregation methods, the following actions can be performed:
• Click to enable or turn off aggregation;
• Click to adjust the priority of aggregation execution;
• Click to delete aggregation.

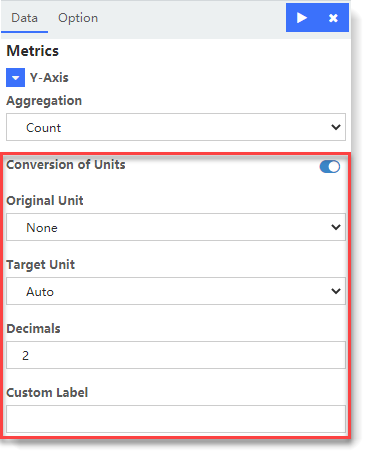
► Conversion of Units: It supports unit conversion settings for metric aggregation fields to improve readability of large data volumes.
There are three types of unit conversion: numerical unit conversion, storage unit conversion and time unit conversion. The corresponding unit conversion type can be selected according to the value type of the selected field.
_15.png) Note: Visualization of unit conversion is not supported: Tag Cloud, Gantt Chart, Markdown, Status Monitoring, Timing Diagram.
Note: Visualization of unit conversion is not supported: Tag Cloud, Gantt Chart, Markdown, Status Monitoring, Timing Diagram.
► View Configuration Options:
• Chart Mode:
• Stacked: The aggregation result is stacked on the top;
• Overlap: Translucent effect is adopted in the overlapped part of aggregation results;
• Percentage: Display the percentage value of each aggregation in the total;
• Wiggle: Aggregation results show streamline graph effect;
• Silhouette: Display the variance relative to the middle line of each aggregation
• Smooth Lines: After checking configuration, smooth data points are connected by curves;
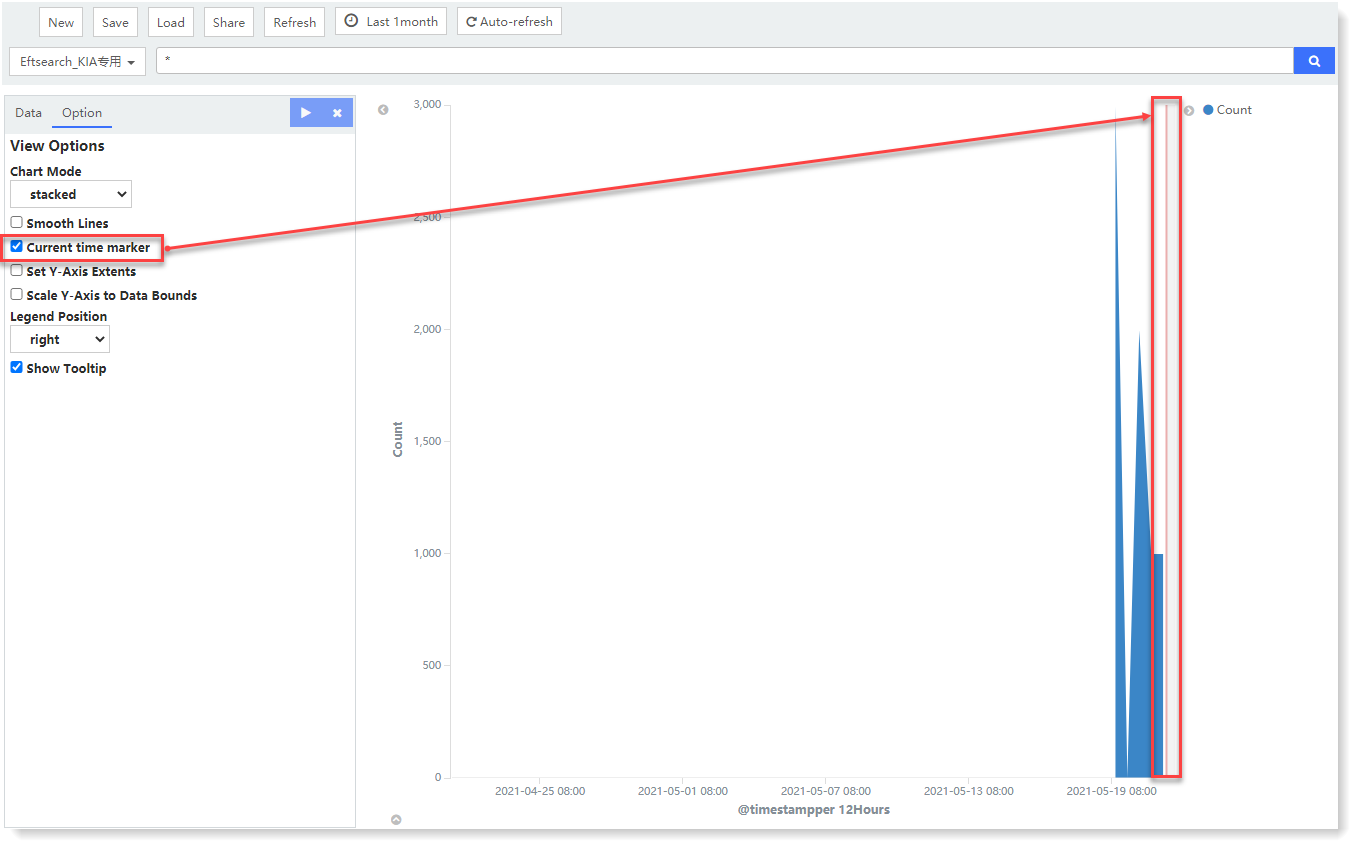
• Current Time Marker: When ticked, a red line will be displayed to mark the current point in time, as follows:
• Set Y-Axis Extents: It is to set the maximum and minimum values of Y axis to specify the measurement range;
• Scale Y-Axis to Data Bounds: The default length of Y axis is 0 to the maximum value of data set. If this option is ticked, Y axis data boundary will be set by dynamically scaling according to the return value of data set;
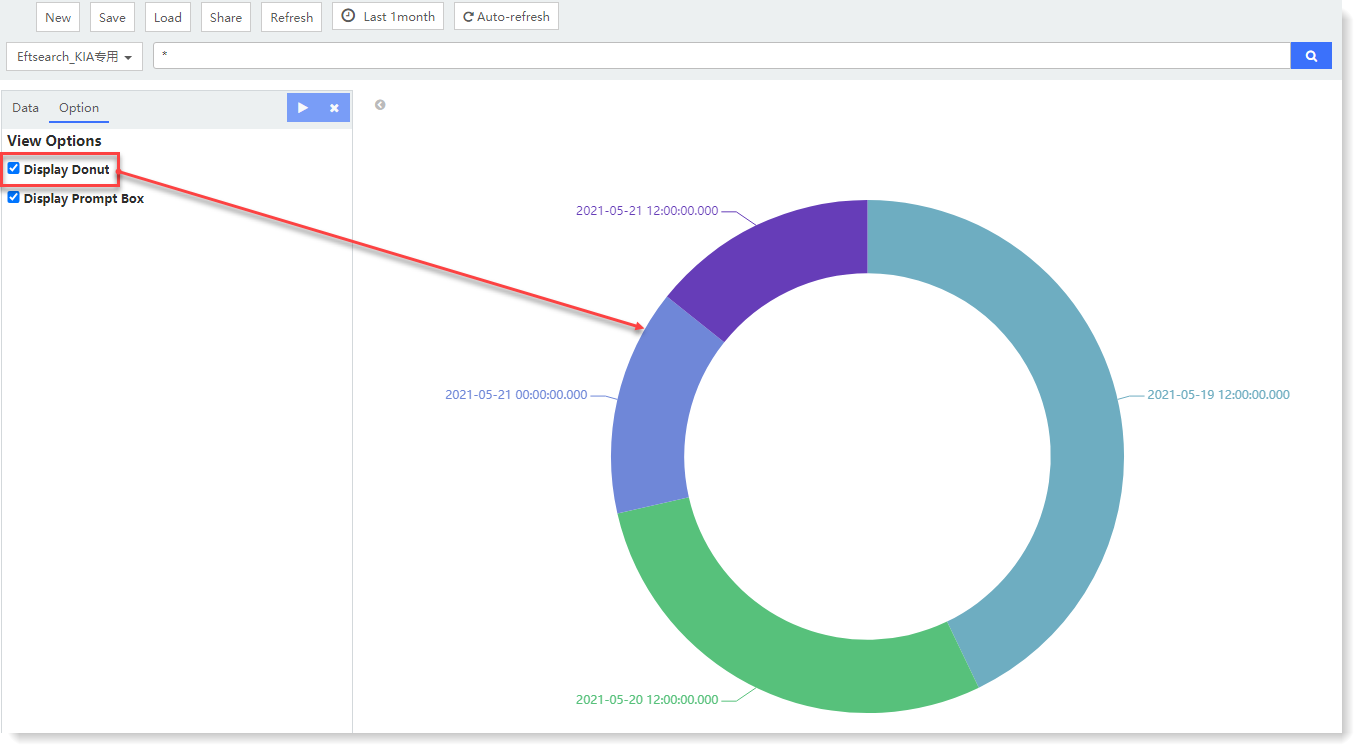
• Display Donut: If ticked, donut chart will replace the pie chart. The view display effect is as follows:
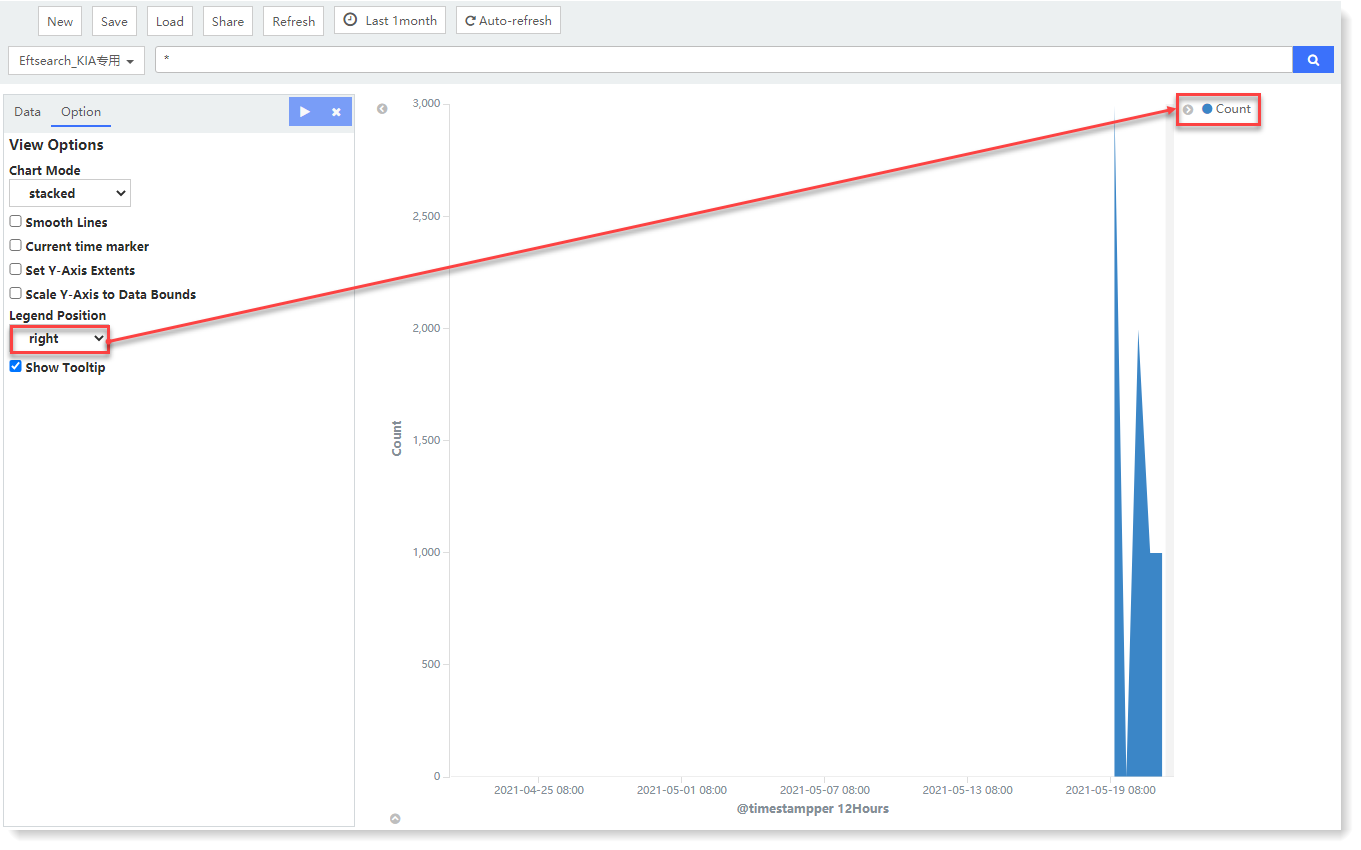
• Legend Position: Top, Left, Right, Bottom, as follows:
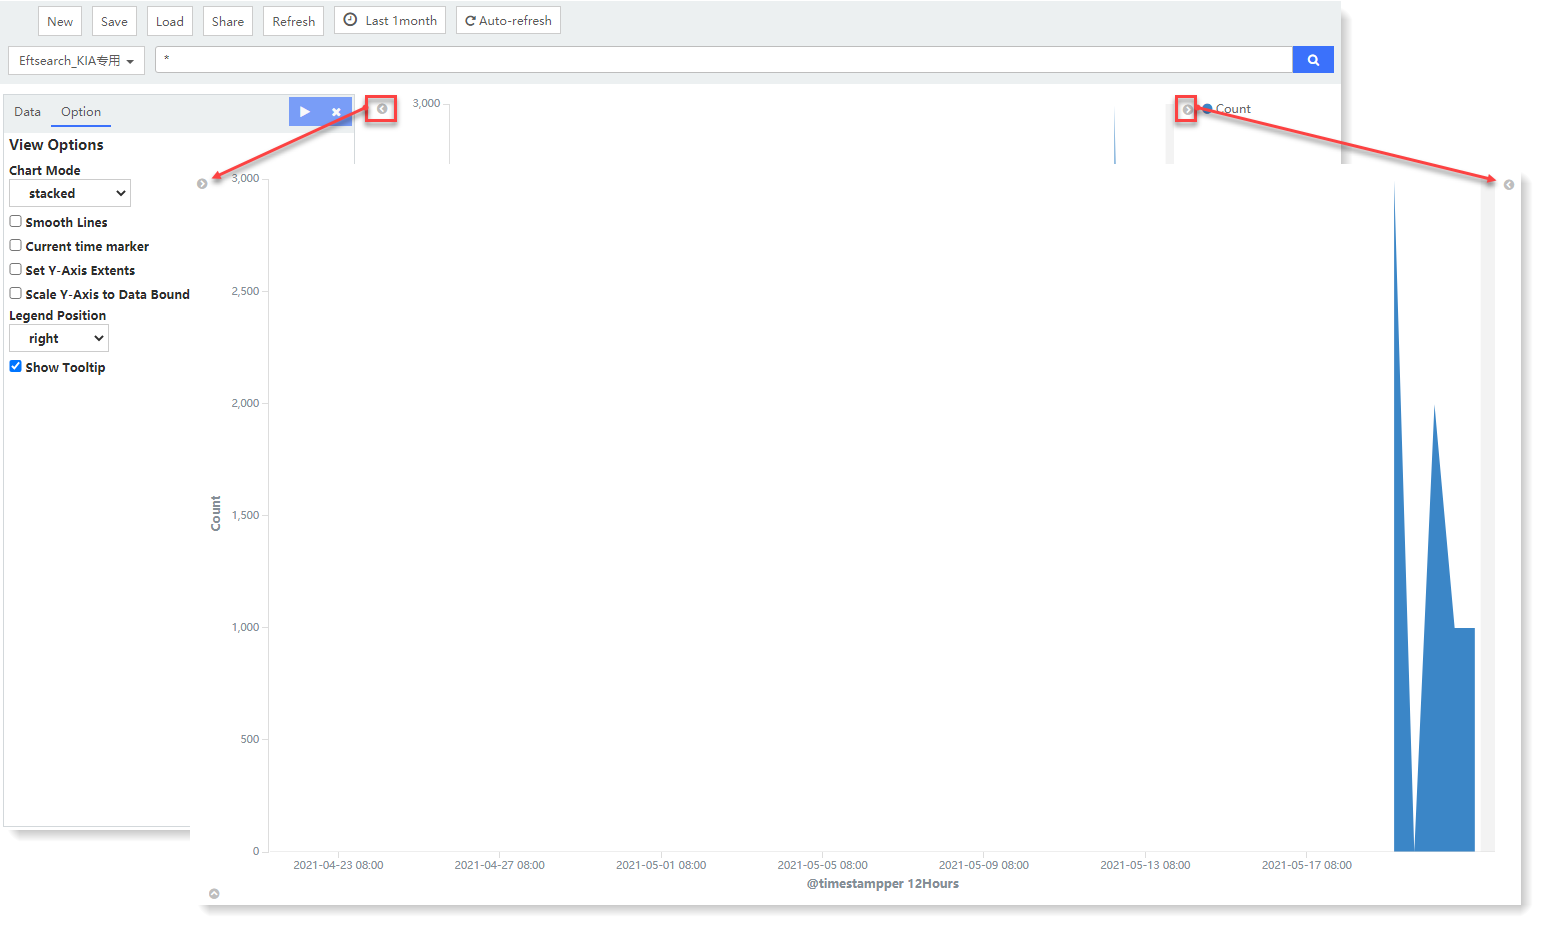
• Hide/Show Configuration Parameter Box and Legend Location: Click to hide/show the configuration parameter box and legend identification, as follows:
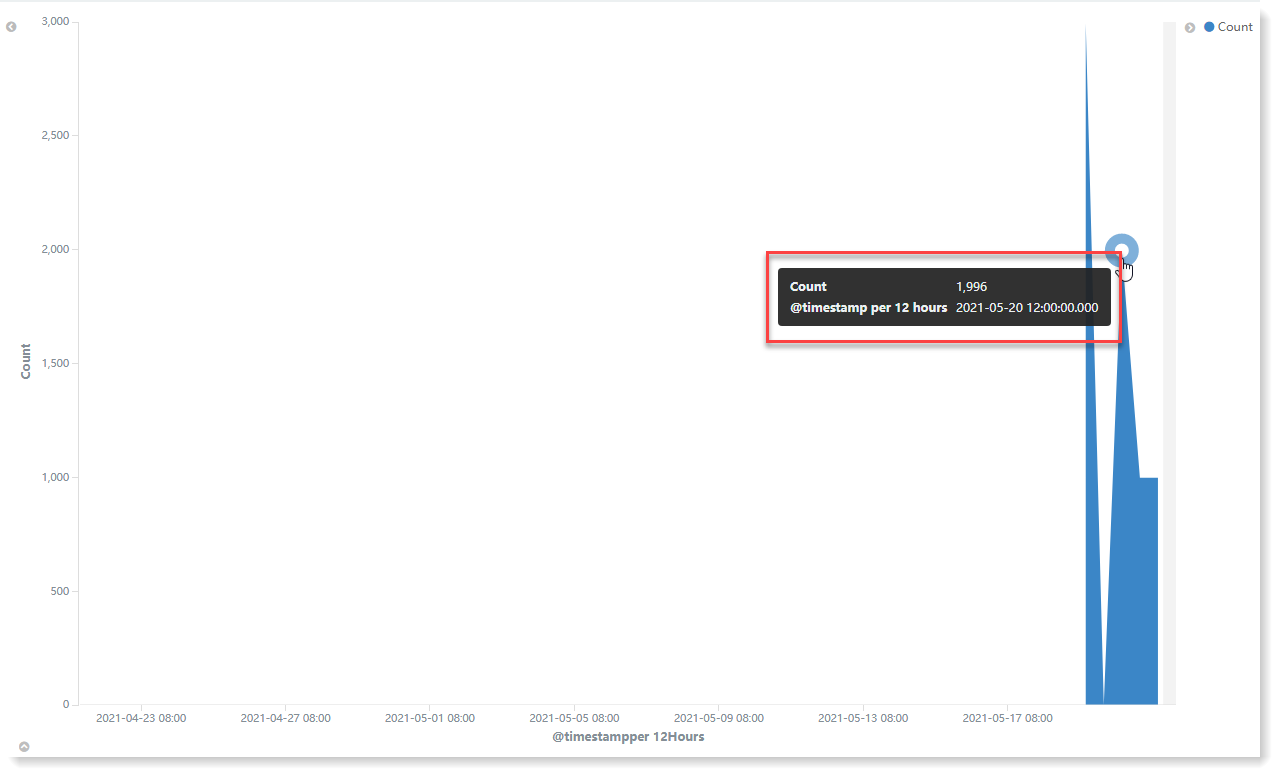
• Check View Aggregation Value Details
Hover over a value point in the view to check the prompted details, including: metric aggregation method, metric aggregation value, bucket aggregation field and bucket aggregation field value, as follows:
► Aggregation method control: When configuring multiple metrics or bucket aggregation methods, the following actions can be performed:
• Click
to enable or turn off aggregation;• Click
to adjust the priority of aggregation execution;• Click
to delete aggregation.► Conversion of Units: It supports unit conversion settings for metric aggregation fields to improve readability of large data volumes.
There are three types of unit conversion: numerical unit conversion, storage unit conversion and time unit conversion. The corresponding unit conversion type can be selected according to the value type of the selected field.
Note: Visualization of unit conversion is not supported: Tag Cloud, Gantt Chart, Markdown, Status Monitoring, Timing Diagram.► View Configuration Options:
• Chart Mode:
• Stacked: The aggregation result is stacked on the top;
• Overlap: Translucent effect is adopted in the overlapped part of aggregation results;
• Percentage: Display the percentage value of each aggregation in the total;
• Wiggle: Aggregation results show streamline graph effect;
• Silhouette: Display the variance relative to the middle line of each aggregation
• Smooth Lines: After checking configuration, smooth data points are connected by curves;
• Current Time Marker: When ticked, a red line will be displayed to mark the current point in time, as follows:
• Set Y-Axis Extents: It is to set the maximum and minimum values of Y axis to specify the measurement range;
• Scale Y-Axis to Data Bounds: The default length of Y axis is 0 to the maximum value of data set. If this option is ticked, Y axis data boundary will be set by dynamically scaling according to the return value of data set;
• Display Donut: If ticked, donut chart will replace the pie chart. The view display effect is as follows:
• Legend Position: Top, Left, Right, Bottom, as follows:
• Hide/Show Configuration Parameter Box and Legend Location: Click
to hide/show the configuration parameter box and legend identification, as follows: • Check View Aggregation Value Details
Hover over a value point in the view to check the prompted details, including: metric aggregation method, metric aggregation value, bucket aggregation field and bucket aggregation field value, as follows:
< Previous:
Next: >