


Updated at: 2022-12-09 03:49:50
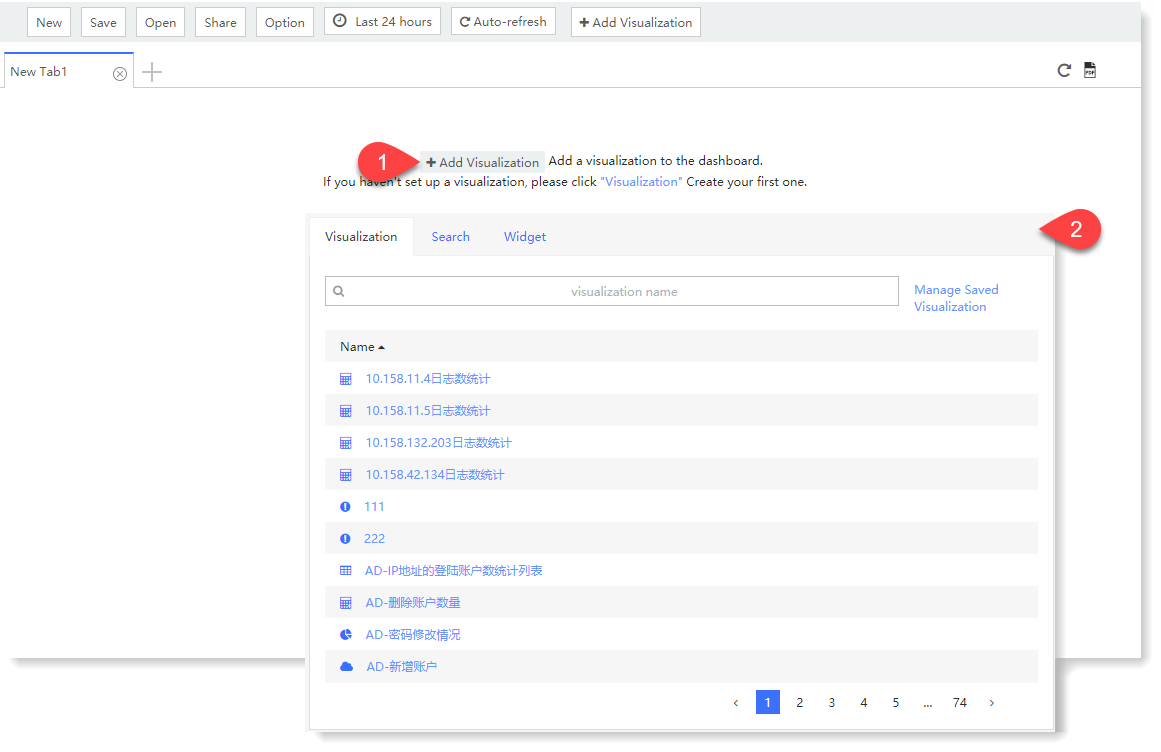
1. Enter the Dashboard page. By default, a blank dashboard creation page will be displayed. Click + Add Visualization to display the page of saved Visualization list, saved Search and global search Widget, where you can click the dashboard object to be added, as follows:
 2. For the visualization added to the dashboard, you can perform the following actions:
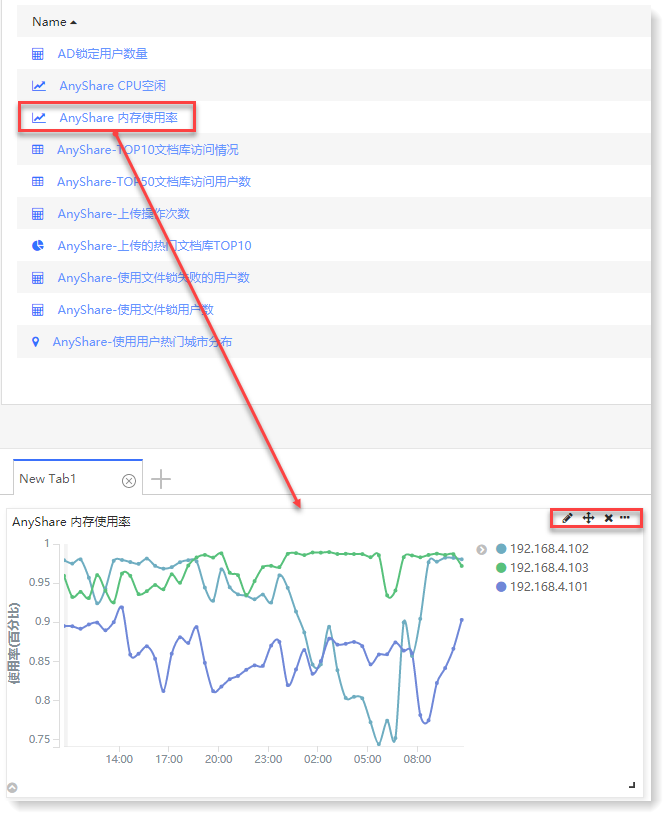
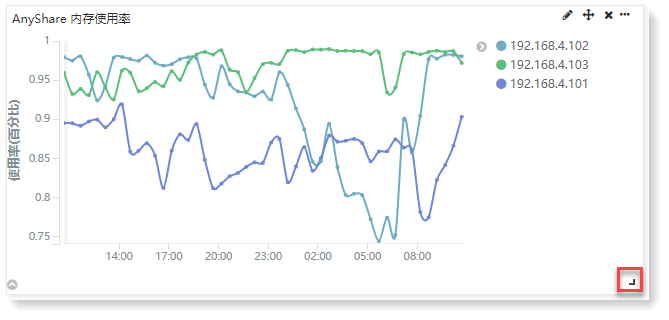
• Move: Click and drag to adjust the placement of the visualization on the dashboard and drag the bottom right corner of the chart container to zoom the container, as follows:
• Click to access the corresponding visualization editing page;
• Click to delete the visualization;
• Jump Settings: Click to display Jump Settings, set the target Dashboard and Tag page to jump to, and the filter condition. After successful setting, click on the visualization title to jump directly to the linked target dashboard page, as follows:
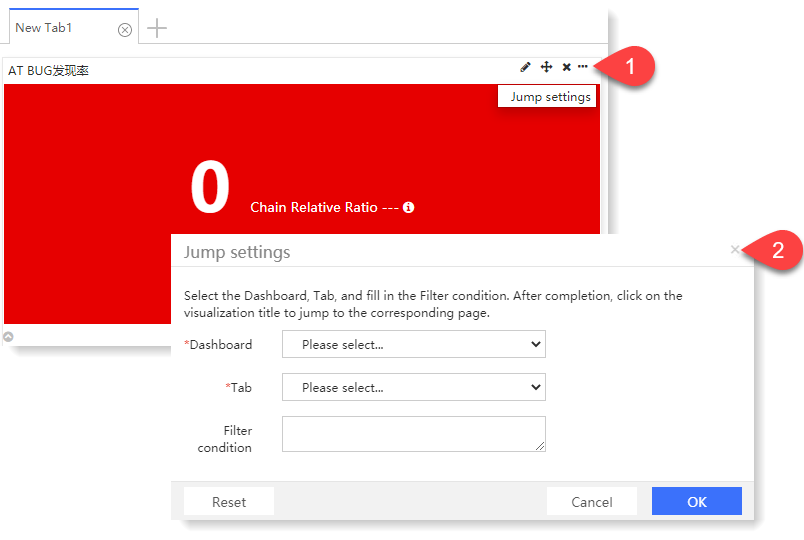
_41.png) Note: If the linkage clicking does not jump, please check if it is blocked by your browser.
Note: If the linkage clicking does not jump, please check if it is blocked by your browser.
3. For a dashboard object, you can add, edit and drag multiple tags and follow the loading strategy of multi-tag dashboard, meaning only the currently selected tab is loaded, and multiple tags can present various levels of data analysis results for users.
4. Click Save to name this dashboard, and Click OK to complete the dashboard creation, as follows:
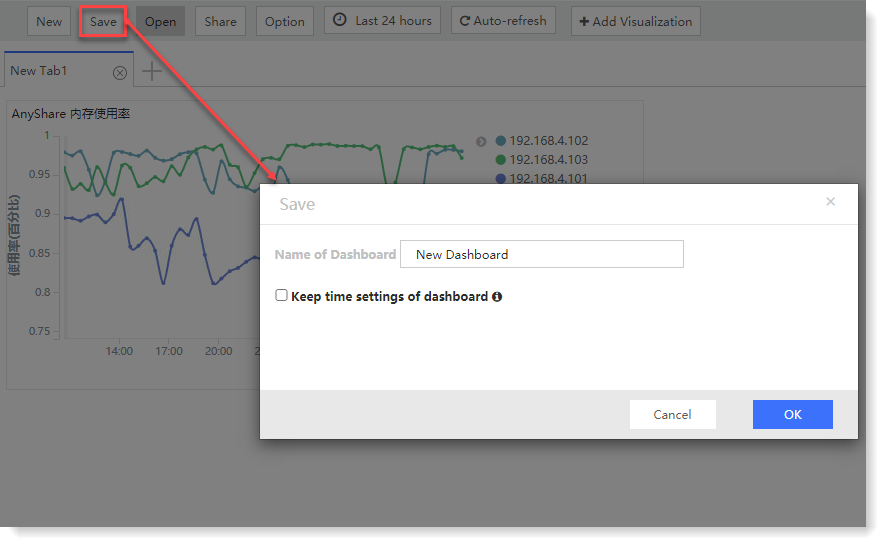
Note: If the option Keep the time settings of dashboard is ticked, it means that every time you open this dashboard, the TimePicker will automatically adjust to the currently selected time range in dashboard.
2. For the visualization added to the dashboard, you can perform the following actions: •
Move: Click and drag to adjust the placement of the visualization on the dashboard and drag the bottom right corner of the chart container to zoom the container, as follows: •
Click to access the corresponding visualization editing page;•
Click to delete the visualization;•
Jump Settings: Click to display Jump Settings, set the target Dashboard and Tag page to jump to, and the filter condition. After successful setting, click on the visualization title to jump directly to the linked target dashboard page, as follows: Note: If the linkage clicking does not jump, please check if it is blocked by your browser.3. For a dashboard object, you can add, edit and drag multiple tags and follow the loading strategy of multi-tag dashboard, meaning only the currently selected tab is loaded, and multiple tags can present various levels of data analysis results for users.
4. Click Save to name this dashboard, and Click OK to complete the dashboard creation, as follows:
Note: If the option Keep the time settings of dashboard is ticked, it means that every time you open this dashboard, the TimePicker will automatically adjust to the currently selected time range in dashboard.
< Previous:
Next: >