


Updated at: 2022-12-09 03:49:50
It is the visual representation of text data, mostly to visualize free-form text. A Tag is usually a single word whose font size corresponds to its importance. The specific steps are as follows:
1. Click Visualization > Tag Cloud to select data sources. You can filter out the required data sources by selecting Log Group or Saved Search;
2. Make tag cloud visualization editing, and configure parameters as follows:
1) Tag Size
• Aggregation: Select the type of aggregation for the y-axis: Count (default), Avg, Sum, Median, Min, Max, Unique Count;
• Custom Tag: Set the axis name displayed on the Y axis
2) Buckets - Bucket: Classify bucket aggregation by tag according to the selected fields:
• Aggregation: Configure the fields corresponding to entries and the sorting method
3. After completing the above configuration, click the button at the top left to check the visual view on the right, as follows:
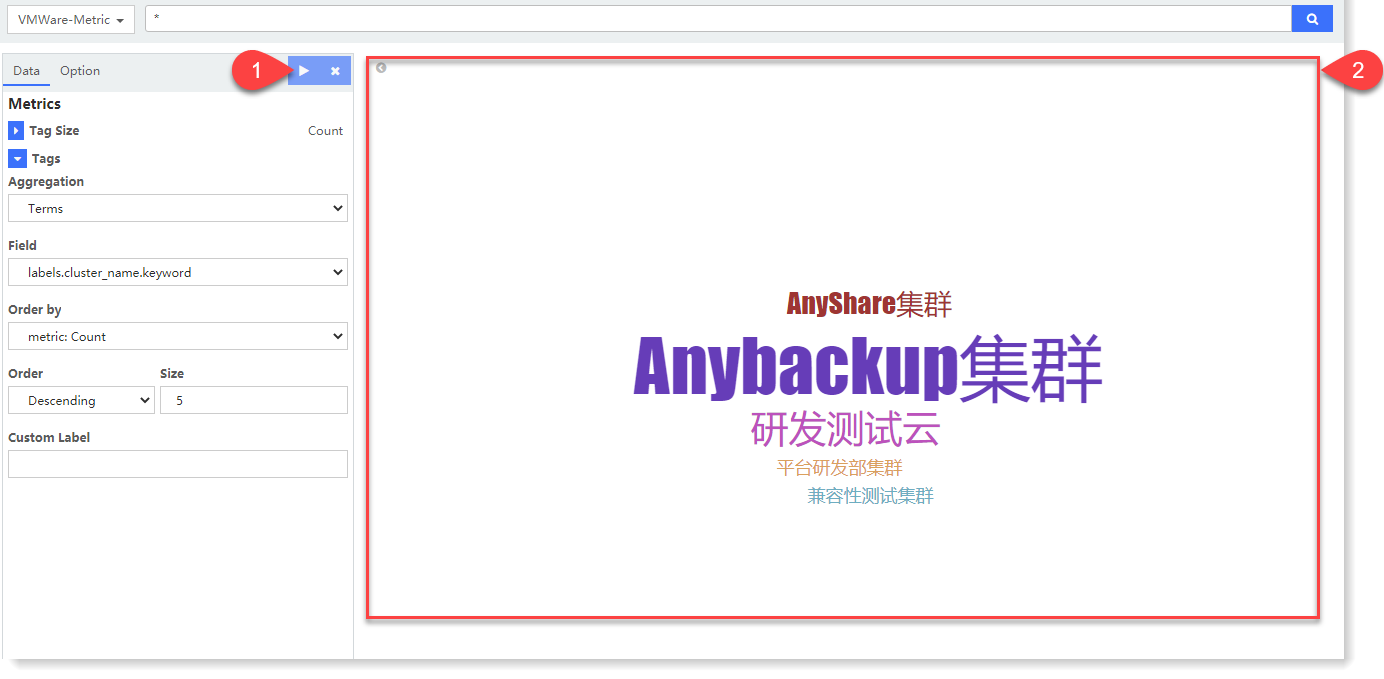 In the above example, through entry aggregation, the log data count results are displayed as tags according to the aggregation field type.keyword. In the above example: For the past 5 years, the log data types with the Top-5 number of logs are displayed according to the log type (type.keyword). The larger the tag, the larger the corresponding statistical value.
4. For the generated chart, you can also switch to Option and set the following parameters:
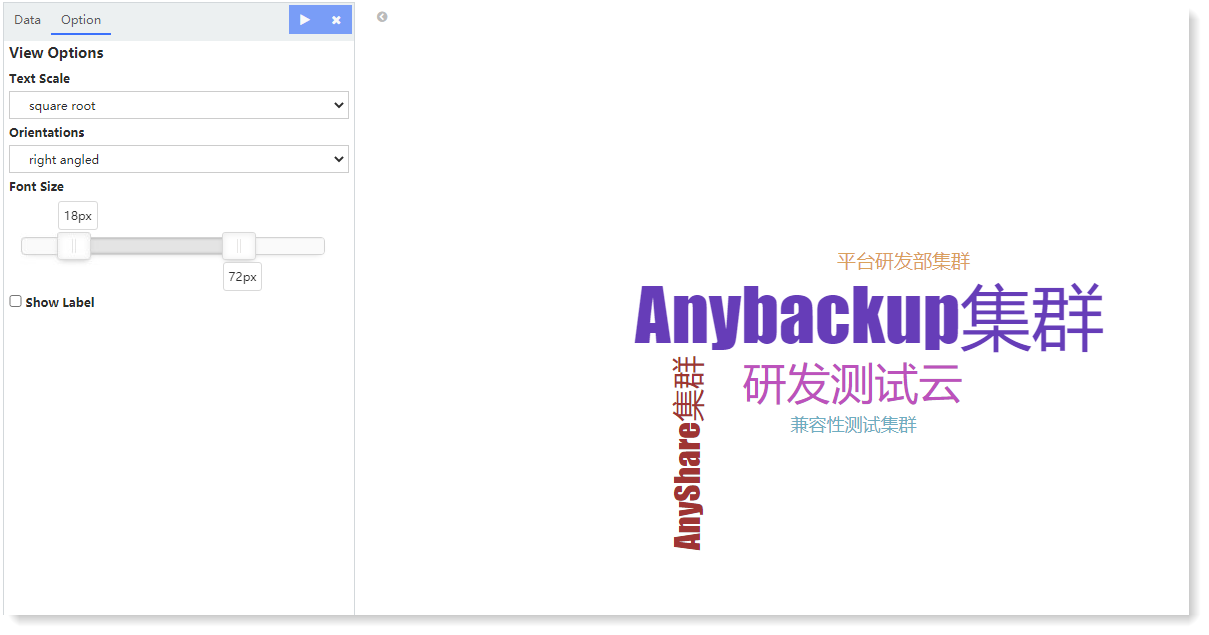
• Text Scale: linear, log, and square root;
• Orientations: The display angle of tag: single, right angled, and multiple;
• Font Size: Set the maximum font size for tag display.
5. Click Save to complete the current visual view creation.
1. Click Visualization > Tag Cloud to select data sources. You can filter out the required data sources by selecting Log Group or Saved Search;
2. Make tag cloud visualization editing, and configure parameters as follows:
1) Tag Size
• Aggregation: Select the type of aggregation for the y-axis: Count (default), Avg, Sum, Median, Min, Max, Unique Count;
• Custom Tag: Set the axis name displayed on the Y axis
2) Buckets - Bucket: Classify bucket aggregation by tag according to the selected fields:
• Aggregation: Configure the fields corresponding to entries and the sorting method
3. After completing the above configuration, click the
button at the top left to check the visual view on the right, as follows: In the above example, through entry aggregation, the log data count results are displayed as tags according to the aggregation field type.keyword. In the above example: For the past 5 years, the log data types with the Top-5 number of logs are displayed according to the log type (type.keyword). The larger the tag, the larger the corresponding statistical value.4. For the generated chart, you can also switch to Option and set the following parameters:
• Text Scale: linear, log, and square root;
• Orientations: The display angle of tag: single, right angled, and multiple;
• Font Size: Set the maximum font size for tag display.
5. Click Save to complete the current visual view creation.
< Previous:
Next: >