


Updated at: 2022-12-09 03:49:50
It can visually display the activity list for an event and its time scale, and show the sequence and duration of activities for a particular item, as follows:
1. Click Visualization > Gannt to select data sources. You can filter out the required data sources by selecting Log Group or Saved Search;
2. Make gannt visualization editing, and configure parameters as follows:
1) Configure Y Axis parameters:
• Field: Set the fields to be aggregated for Y Axis;
• Order by: Time Series, Custom Metric (Count, Avg, Sum, Median, Min, Max, Unique Count, Percentiles, Percentile Ranks);
• Custom Tag: Set the axis name displayed on the Y axis
2) Configure X Axis parameters:
• Start Time: Select the start time field for statistical aggregation;
• End Time: Select the end time field for statistical aggregation.
3. After completing the above configuration, click the button at the top left to check the visual view on the right, as follows:
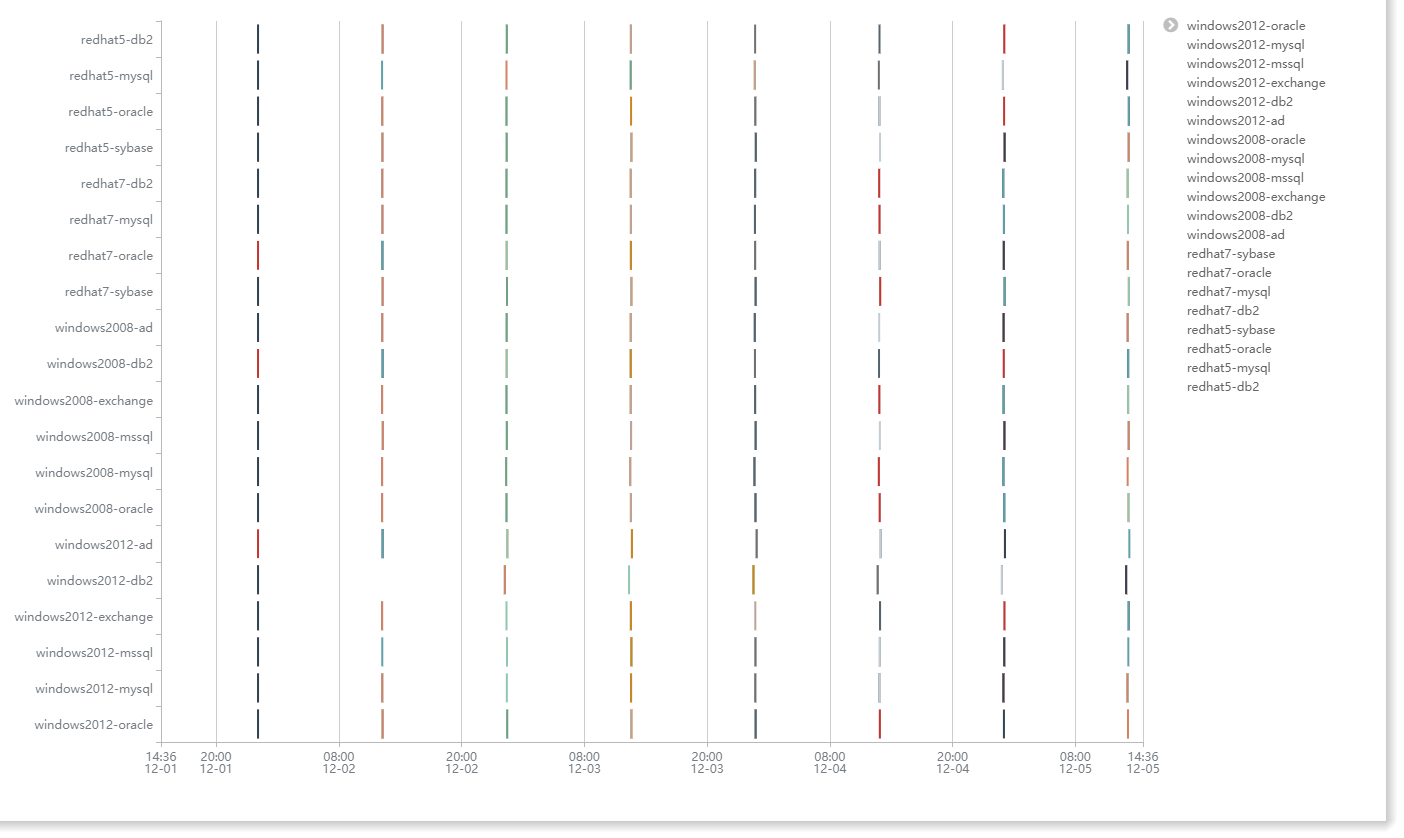 Taking a backup software as an example, you can view the activity list and duration of a backup task in Gantt. Selects the file name for Y-axis Field, and select the X-Axis start field as Start Time and end field as End Time.
4. Click Save to complete the current visual view creation.
1. Click Visualization > Gannt to select data sources. You can filter out the required data sources by selecting Log Group or Saved Search;
2. Make gannt visualization editing, and configure parameters as follows:
1) Configure Y Axis parameters:
• Field: Set the fields to be aggregated for Y Axis;
• Order by: Time Series, Custom Metric (Count, Avg, Sum, Median, Min, Max, Unique Count, Percentiles, Percentile Ranks);
• Custom Tag: Set the axis name displayed on the Y axis
2) Configure X Axis parameters:
• Start Time: Select the start time field for statistical aggregation;
• End Time: Select the end time field for statistical aggregation.
3. After completing the above configuration, click the
button at the top left to check the visual view on the right, as follows: Taking a backup software as an example, you can view the activity list and duration of a backup task in Gantt. Selects the file name for Y-axis Field, and select the X-Axis start field as Start Time and end field as End Time.4. Click Save to complete the current visual view creation.
< Previous:
Next: >