Updated at: 2022-12-09 03:49:50
Click KAI > Alerts Check, where you can view all alert records, and click  /  to switch the view display model (Denoised Model / Detailed Model).
• Denoised Model: It is enabled by default, and supports intelligent merging of alert records based on alert name, service and KPI dimensions. The merging period can be set through the noise reduction time window (default 5 minutes), as follows: 
Field Name Description
Severity It indicates the severity level of the current alert.
Note: This severity level is determined according to the KPI severity level set in alert trigger. If multiple triggers exist, the higher severity level in triggers will be displayed as alert severity.
Denoised Count It indicates the number of alerts currently merged by intelligent noise reduction.
Description It indicates the current alert noise reduction content description: xxx (service name) has generated xxx alerts according to xxx (alert policy name).
Example: "Tomcat service has generated 4 alerts according to performance detection".
Merge Basis It indicates the merging dimension of the current intelligent noise reduction. The dimension is automatically generated by the intelligent algorithm: Service/KPI/Alert Name
Time Range It indicates the time range merged by intelligent noise reduction, which is generated according to the noise reduction time window interval.
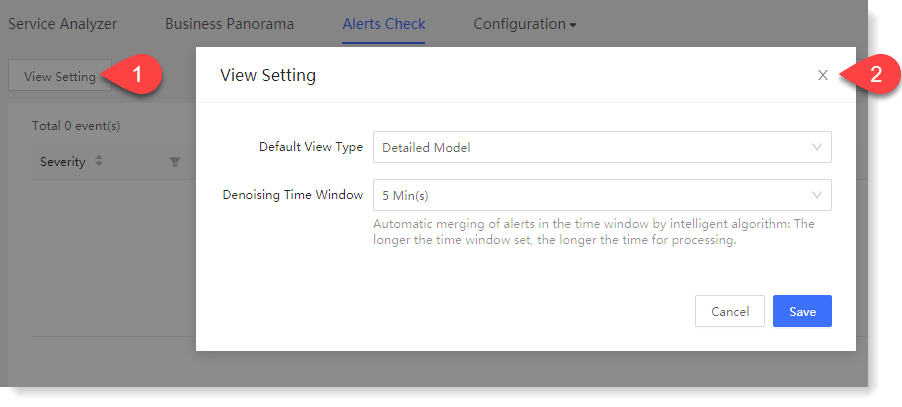
• Detailed Model: It indicates that once the alert condition is triggered within the alert time range, an alert record will be generated synchronously according to the alert suppression frequency.
Field Name Description
Severity It indicates the severity level of the current alert.
Note: This severity level is determined according to the KPI severity level set in alert trigger. If multiple triggers exist, the higher severity level in triggers will be displayed as alert severity.
Denoised Count It indicates the number of alerts currently merged by intelligent noise reduction.
Description It indicates the content description of the current alert: xxx (service name) /xxx (KPI name) + trigger, at alert time
Example:
• Alert scenario: "When the average CPU value in MySQL service is equal to high risk twice and the average Memory value in MySQL service is equal to medium risk once, an alert will be triggered, alert monitoring will be performed within the time range of alert time from 00: 00 to 23: 59, alert judgment will be performed once every 10 minutes, and alert suppression will be enabled for 1 hour".
• Alert description generated: "The average value of MySQL/CPU is equal to high-risk twice, and the average value of MySQL/Memory is equal to medium-risk once, from 06-17 00: 00: 00 to 06-17 23: 59: 59”.
Time It indicates the point in time at which the current alert condition is triggered, and is the point in time at which the alert event is generated by the alert suppression frequency.