


Updated at: 2022-12-09 03:49:50
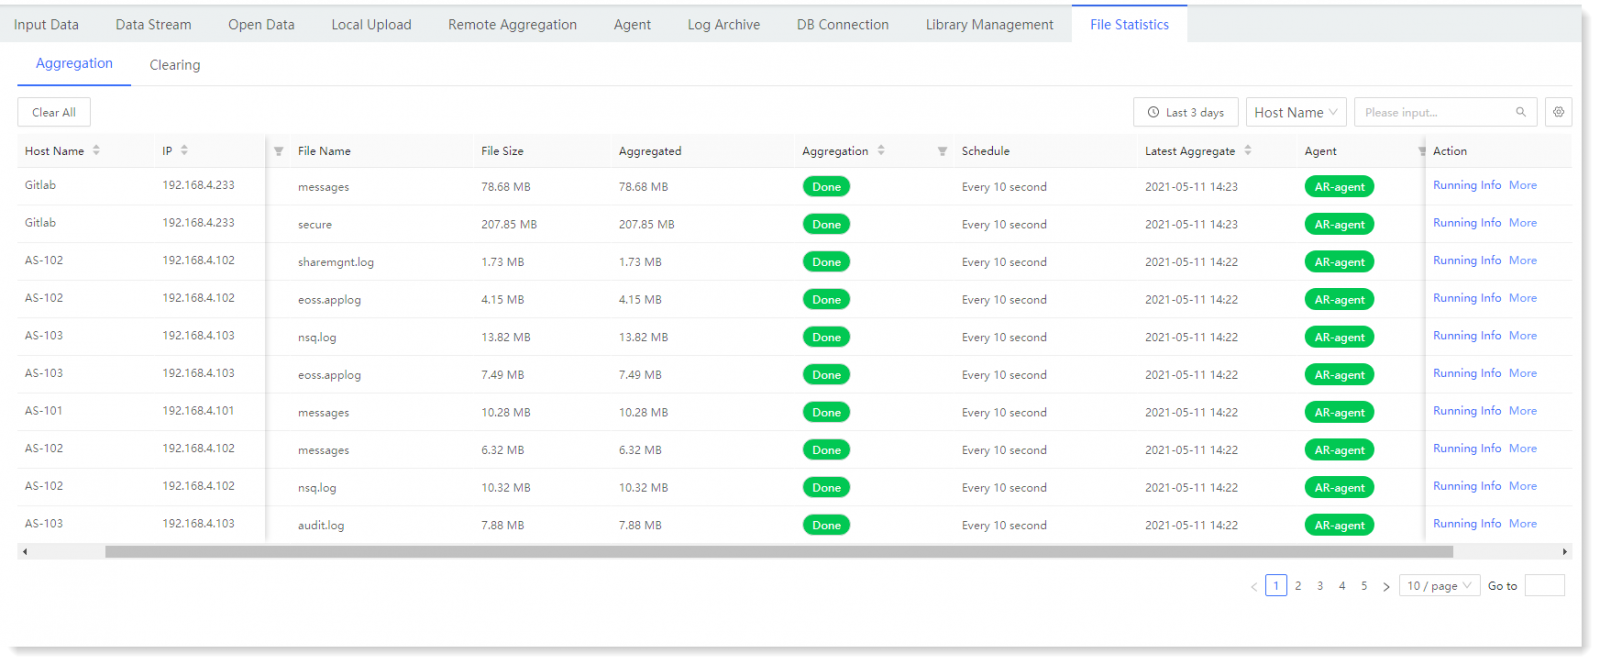
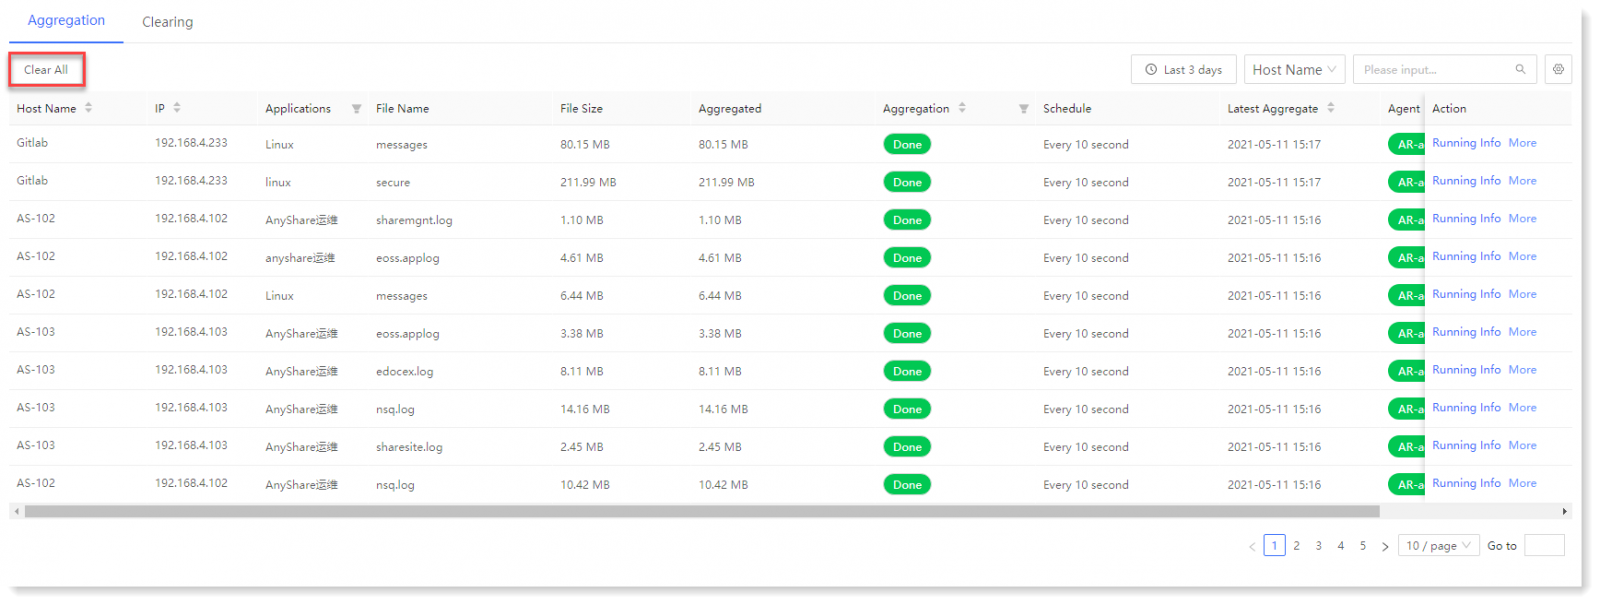
Click Data Source > File Statistics > Aggregation, where you can view the basic information, aggregation status, Agent running status, aggregation execution frequency, file aggregation details, search files, clear log aggregation records, and perform other functional operations.
_27.png) Note:
Note:
1. Click the icon to customize column entries displayed;
2. It supports filtering and displaying file aggregation list data by Applications, Aggregation, Agent, and Task Status.
3. It supports displaying data in the file aggregation list in ascending or descending order by Host Name, IP, Aggregation and Latest Update. • Checking Agent Running Info:
Click Running Info in the action column, to view the basic information and running information of the Agent client, as follows:
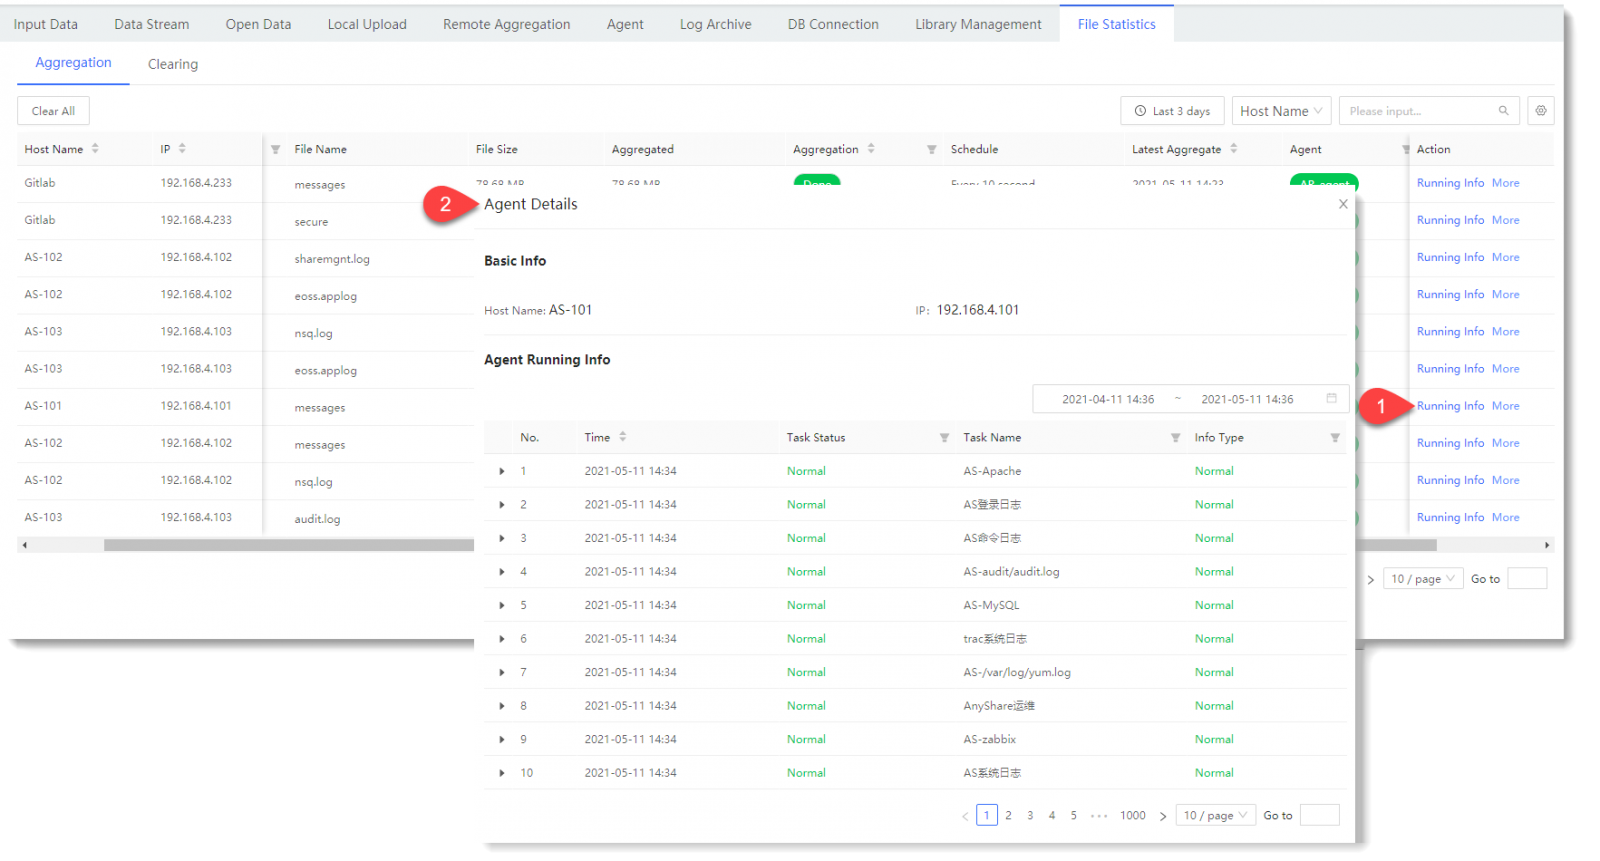 Note: If there are exception task running records, you can click
  to unfold and check the corresponding original log information.
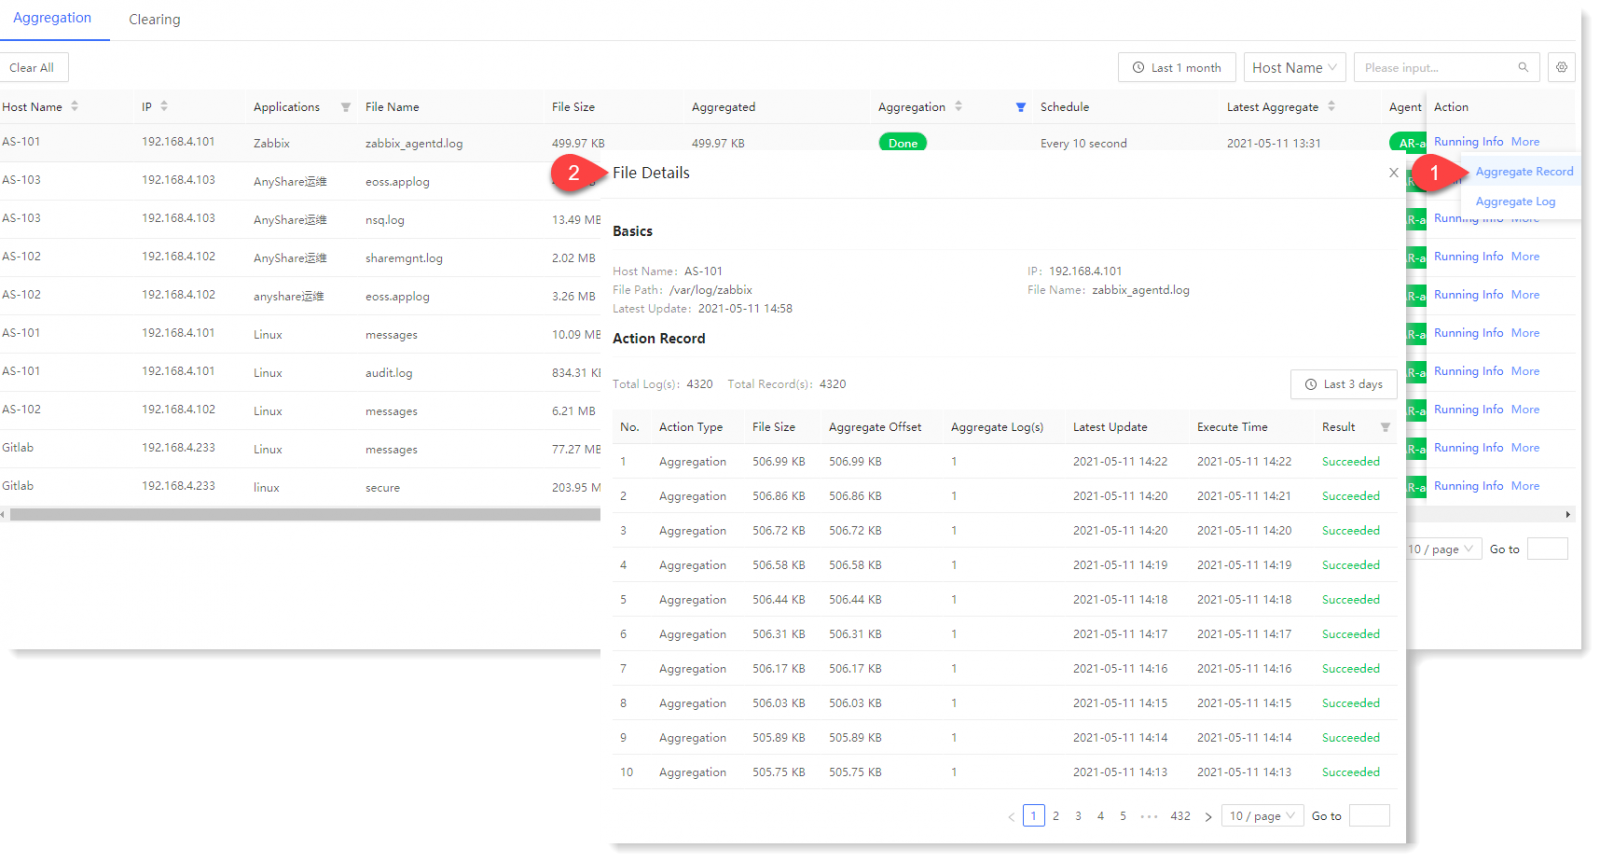
• Check Whole Aggregate Record:
Click Action > More > Aggregate Record, to check the action record of Agent log file aggregation or clearing, which can be filtered and queried through TimePicker, as follows:
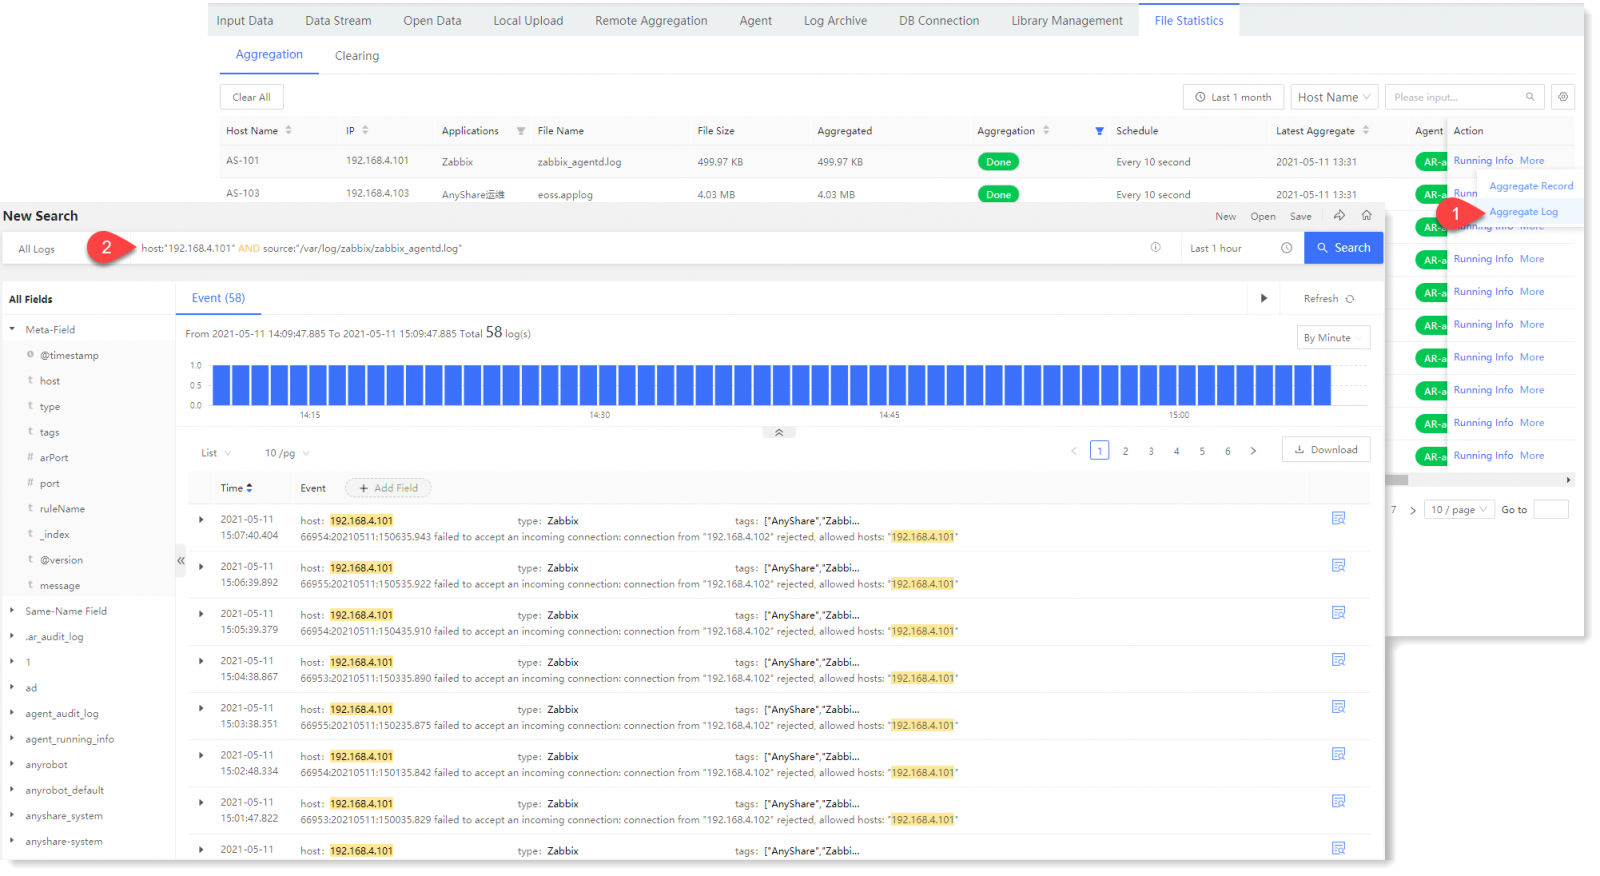
• Check Aggregate Log:
Click Action > More > Aggregate Log, to check the aggregate log in Search, as follows:
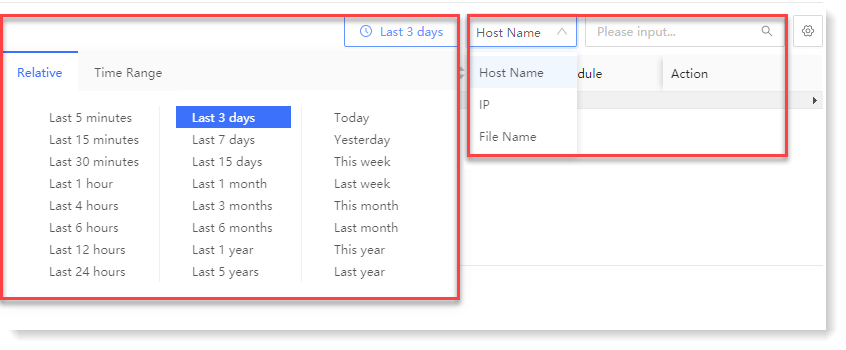
 • It supports the display of file aggregation list information filtered by TimePicker or Keywords (Host Name, IP, File Name) as follows:
• Clear file aggregation records: click Clear All to clear the file aggregation records as follows:
Note:1. Click the
icon to customize column entries displayed;2. It supports filtering and displaying file aggregation list data by Applications, Aggregation, Agent, and Task Status.
3. It supports displaying data in the file aggregation list in ascending or descending order by Host Name, IP, Aggregation and Latest Update. • Checking Agent Running Info:
 : File aggregation task completed
 : File aggregation task paused
 : File aggregation task in progress
 : Agent Client running is normal
 : Agent Client running is abnormal
Click Running Info in the action column, to view the basic information and running information of the Agent client, as follows:
Note: If there are exception task running records, you can click to unfold and check the corresponding original log information.• Check Whole Aggregate Record:
Click Action > More > Aggregate Record, to check the action record of Agent log file aggregation or clearing, which can be filtered and queried through TimePicker, as follows:
• Check Aggregate Log:
Click Action > More > Aggregate Log, to check the aggregate log in Search, as follows:
• It supports the display of file aggregation list information filtered by TimePicker or Keywords (Host Name, IP, File Name) as follows: • Clear file aggregation records: click Clear All to clear the file aggregation records as follows:
< Previous:
Next: >