


Updated at: 2022-12-09 03:49:50
Key performance indicators (KPI) are used to return specific values for performance indicators such as, CPU load percentage, memory usage percentage, or response time. The aggregated values returned by the KPI are used to monitor the health of each service and locate trends with possible anomalies.
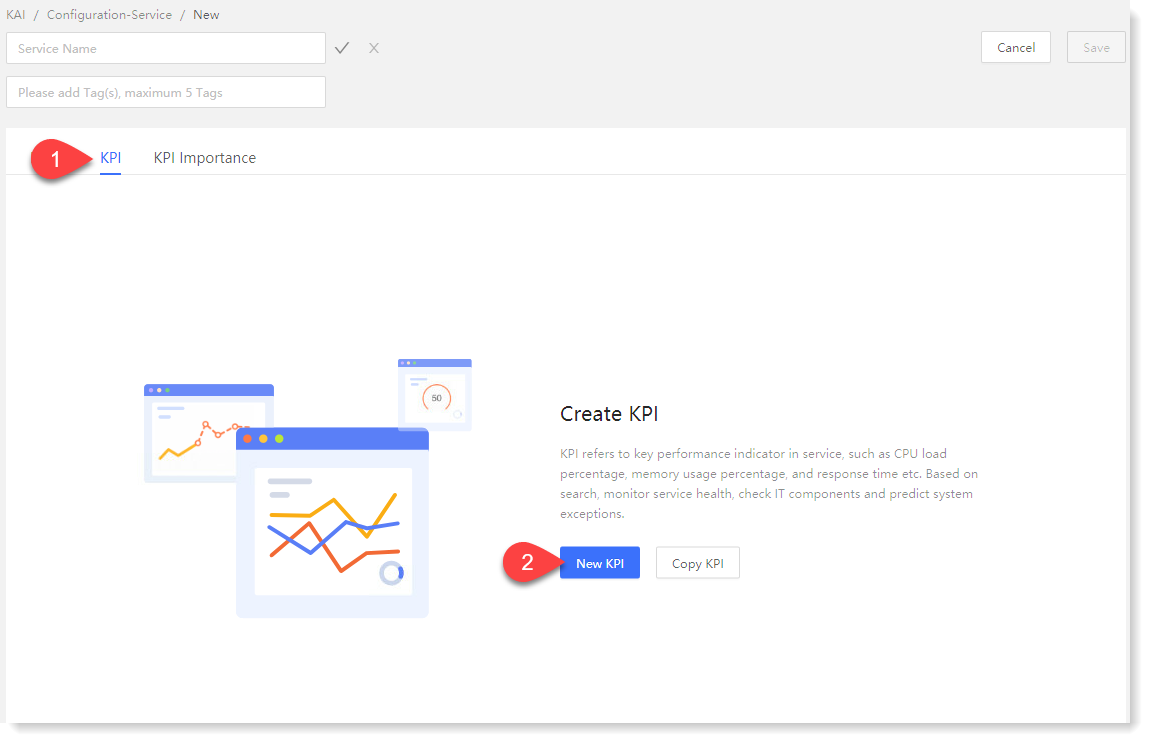
Click New > KPI to make KPI creation, as follows:
► New KPI
1. Click KPI > New KPI to pop up the new KPI window and configure parameters, as follows:
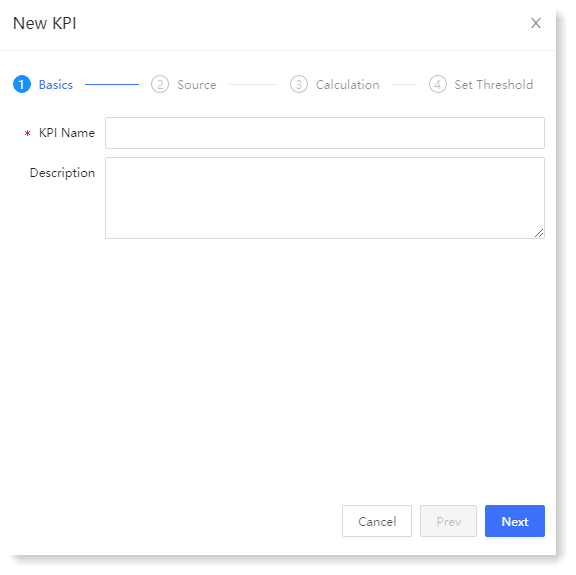
♦ Basic configuration: KPI name configuration and description;
♦ Data Source: It is to configure the data source of KPI aggregation calculation and the time range for searching the data source;
• * KPI Source: It supports saved search, custom search and KPI calculation template:
Click New > KPI to make KPI creation, as follows:
► New KPI
1. Click KPI > New KPI to pop up the new KPI window and configure parameters, as follows:
♦ Basic configuration: KPI name configuration and description;
♦ Data Source: It is to configure the data source of KPI aggregation calculation and the time range for searching the data source;
• * KPI Source: It supports saved search, custom search and KPI calculation template:
• Saved Search: Select the saved searches in the system, as follows:
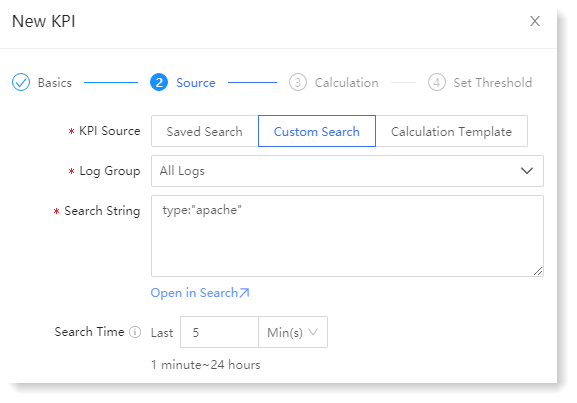
• Custom Search: Enter a custom search statement to search, click Open in Search to jump to the search page, and view the search results. It also supports data source filtering through * Log Group, as follows:
_87.png) Note:
Note:
1. If the current user does not have the authority to group the selected log resources, click Open in Search to enter the search page but cannot view the original log. For such need, you can contact the system administrator for resource authorization;
2. If the selected log group is deleted, the configuration needs to be re-selected to ensure the normal output of KPI aggregation value and service health score.
• KPI Calculation Template: It supports the application of saved KPI calculation templates. After selecting templates and indicators, template configuration parameters are automatically imported such as Search Time and KPI Calculation configuration, as follows:
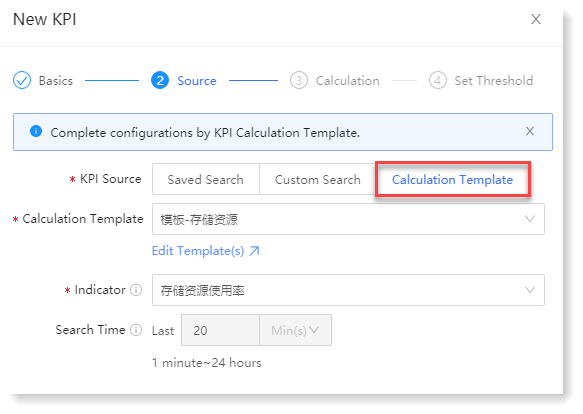
Note: If the KPI calculation template has been associated with a service, and the associated indicators in the KPI calculation template are deleted, aggregation calculation will be stopped for the indicators and the service associated with the indicators, and the result will be displayed as N/A.
• Custom Search: Enter a custom search statement to search, click Open in Search to jump to the search page, and view the search results. It also supports data source filtering through * Log Group, as follows:
Note:1. If the current user does not have the authority to group the selected log resources, click Open in Search to enter the search page but cannot view the original log. For such need, you can contact the system administrator for resource authorization;
2. If the selected log group is deleted, the configuration needs to be re-selected to ensure the normal output of KPI aggregation value and service health score.
• KPI Calculation Template: It supports the application of saved KPI calculation templates. After selecting templates and indicators, template configuration parameters are automatically imported such as Search Time and KPI Calculation configuration, as follows:
Note: If the KPI calculation template has been associated with a service, and the associated indicators in the KPI calculation template are deleted, aggregation calculation will be stopped for the indicators and the service associated with the indicators, and the result will be displayed as N/A.• Search Time: It is to set the time range (1 minute ~ 24 hours) of the data to be calculated, for example, to obtain the log data of the first 10 minutes for aggregation calculation.
2. Click Next to enter the KPI calculation page, and configure entity splitting, indicator aggregation calculation method and execution plan. The configuration parameters are as follows:
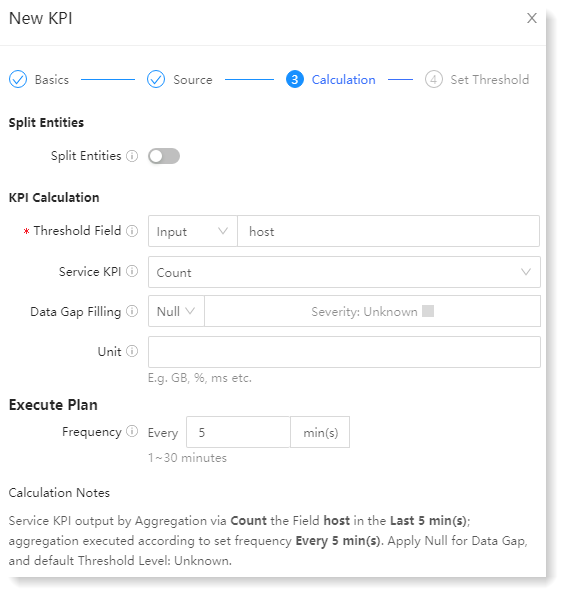
Note: Entity KPI Calculation configuration items will be displayed in indicator calculation column only after Split Entities function is enabled.
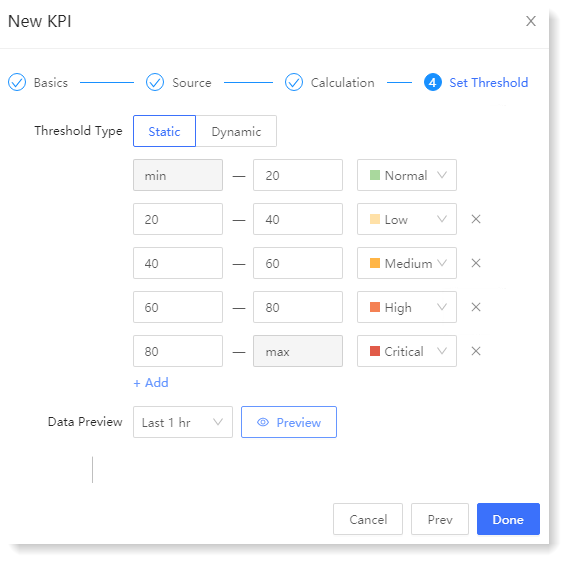
3. Click Next to enter the threshold setting page. The threshold severity level determines the current status of KPI. When the KPI value meets the threshold condition, the KPI status will change accordingly. On this page, you can configure KPI static threshold or dynamic threshold. The configuration parameters are as follows:
• Static Threshold: Manually set fixed threshold and severity as follows:
• Dynamic Threshold: The system will calculate and update the dynamic threshold at 00: 00 every day according to the historical KPI aggregation results. Dynamic threshold severity is determined by the magnitude of the difference between the actual data and the threshold data, i.e. the extent to which the actual data deviates from the threshold data.
The set algorithm sensitivity will affect the dynamic threshold range. The higher the sensitivity, the more anomalies will be detected and the narrower the corresponding threshold range. The default is 3 (highest).
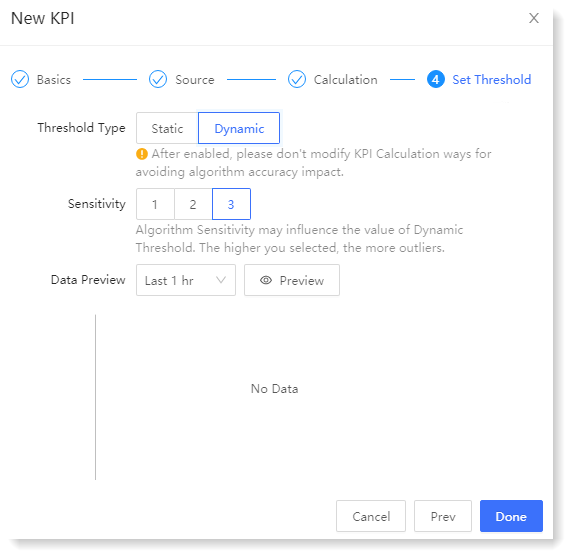
Note: After the dynamic threshold is enabled, please do not modify the KPI calculation method to avoid affecting the accuracy of the algorithm.
► Copy KPI
1. Click KPI > Copy KPI to pop up the Copy KPI window, tick the KPI to be copied in the created KPI list on the left. The right side is the list of selected KPI, and click icon to delete the selected KPI. You can also quickly search for the service and KPI to be copied through the search input box, as follows:
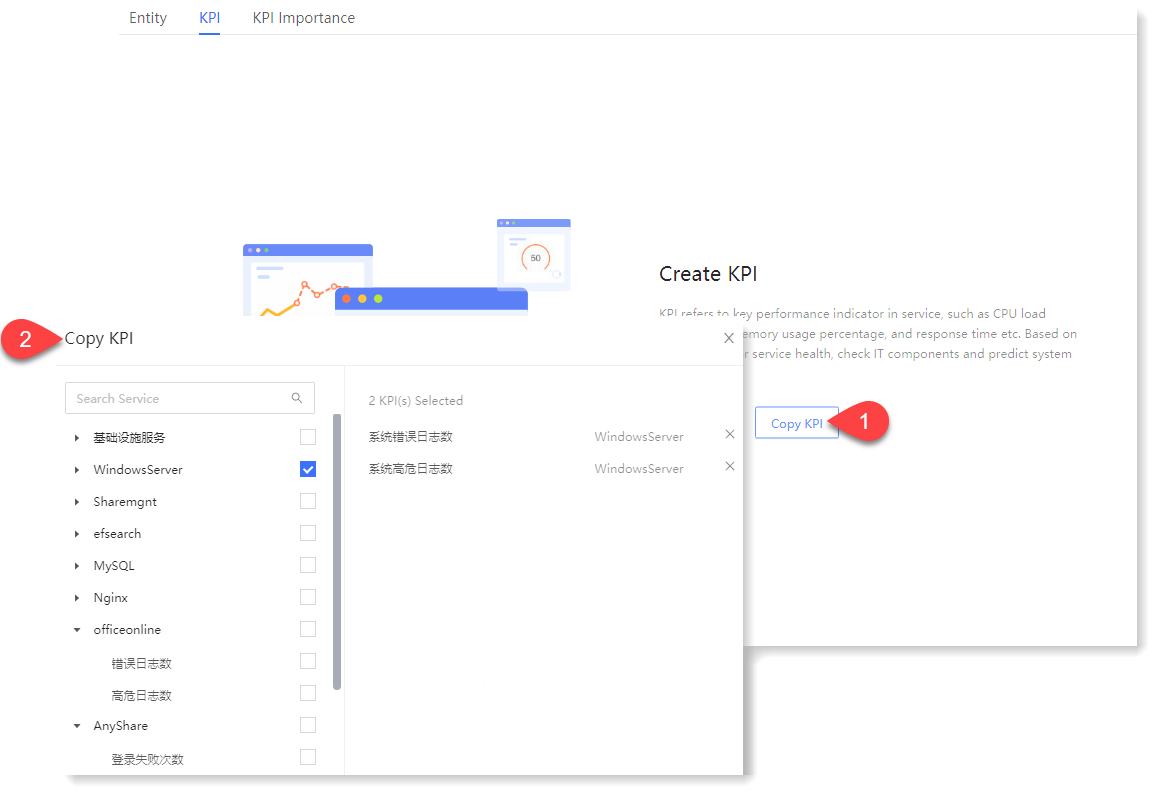
2. After the selection, click Copy to view the list and details of KPIs that have been successfully copied in the KPI configuration, as follows:
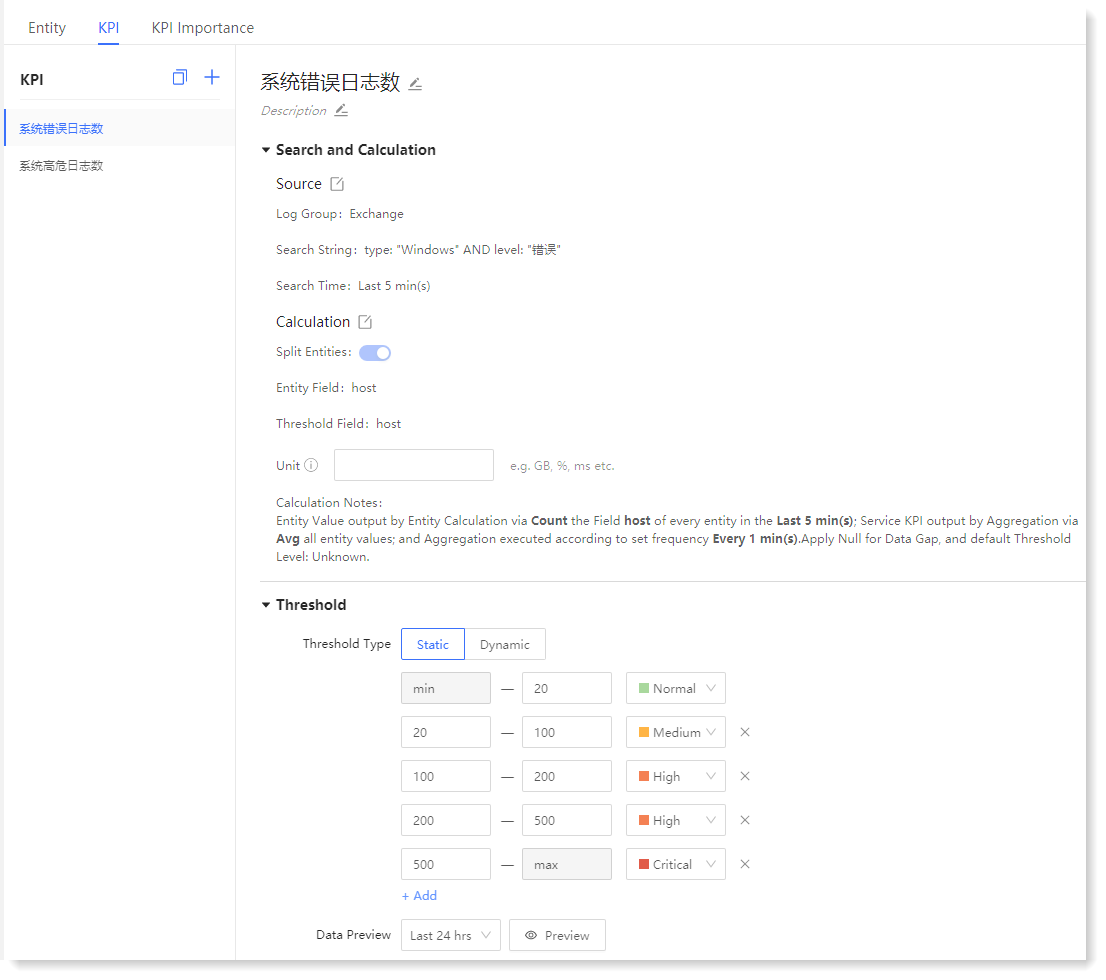
Note: In KPI editing interface, according to threshold and time, click Preview to view the data preview effect.
2. Click Next to enter the KPI calculation page, and configure entity splitting, indicator aggregation calculation method and execution plan. The configuration parameters are as follows:
Note: Entity KPI Calculation configuration items will be displayed in indicator calculation column only after Split Entities function is enabled.
3. Click Next to enter the threshold setting page. The threshold severity level determines the current status of KPI. When the KPI value meets the threshold condition, the KPI status will change accordingly. On this page, you can configure KPI static threshold or dynamic threshold. The configuration parameters are as follows: • Static Threshold: Manually set fixed threshold and severity as follows:
• Dynamic Threshold: The system will calculate and update the dynamic threshold at 00: 00 every day according to the historical KPI aggregation results. Dynamic threshold severity is determined by the magnitude of the difference between the actual data and the threshold data, i.e. the extent to which the actual data deviates from the threshold data.
The set algorithm sensitivity will affect the dynamic threshold range. The higher the sensitivity, the more anomalies will be detected and the narrower the corresponding threshold range. The default is 3 (highest).
Note: After the dynamic threshold is enabled, please do not modify the KPI calculation method to avoid affecting the accuracy of the algorithm.► Copy KPI
1. Click KPI > Copy KPI to pop up the Copy KPI window, tick the KPI to be copied in the created KPI list on the left. The right side is the list of selected KPI, and click icon to delete the selected KPI. You can also quickly search for the service and KPI to be copied through the search input box, as follows:
2. After the selection, click Copy to view the list and details of KPIs that have been successfully copied in the KPI configuration, as follows:
Note: In KPI editing interface, according to threshold and time, click Preview to view the data preview effect.
< Previous:
Next: >