


Updated at: 2022-12-09 03:49:50
Click KAI > Service Analyzer > Create to go the blank initial interface of service analyzer tile view by default.
If the service configuration has been completed, go directly to the interface of service analyzer tile view, as follows:
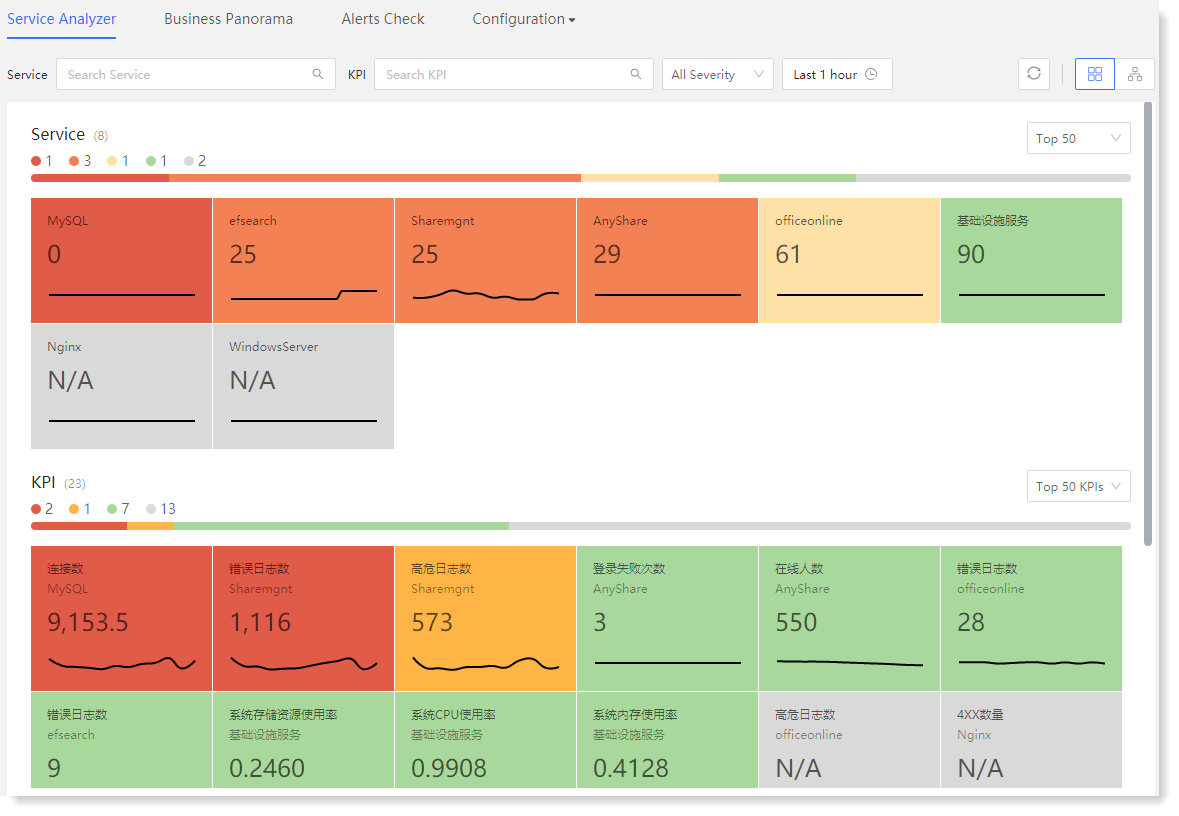
In the tile view, the health score and severity of the top 50 services and the top 50 KPIs for the last 1 hour are displayed by default.
• Service panel: It displays the service name, service health score (the result of latest KPI aggregation), and a graph of the service health score over the selected time period. The relation between the service health score and the severity of the service is as follows:
• KPI panel: It displays KPI and the service name, the KPI aggregation score (the result of latest KPI aggregation), and a graph of the KPI aggregation values over the selected time period;
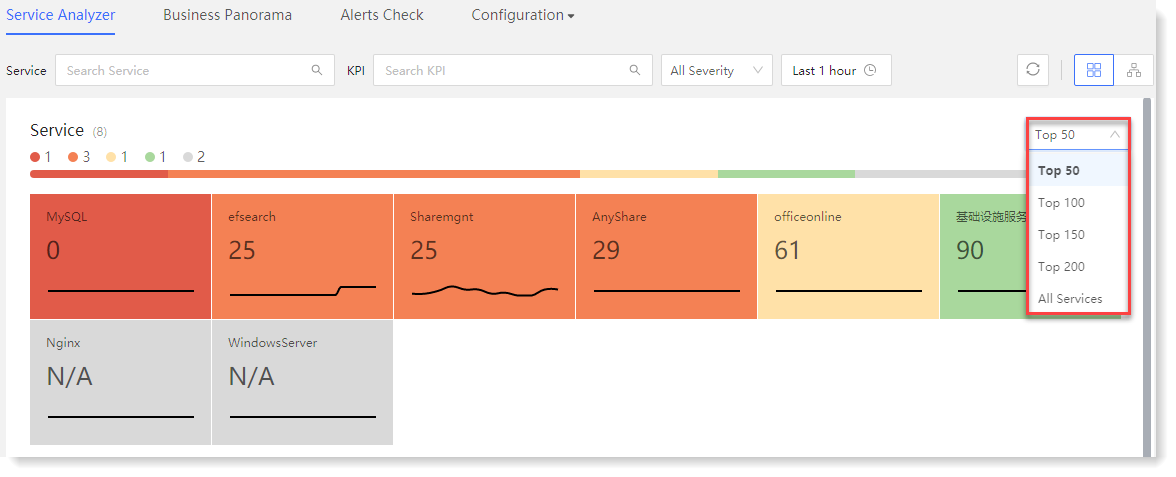
• Switch the number of panels displayed: you can set the number of service and KPI panels displayed on the interface according to actual needs, as follows:
_15.png) Note: Services and KPI panels are sorted by severity from highest to lowest by default. The services with the same severity are sorted by health score from lowest to highest. The KPIs with the same severity are sorted by KPI update time in reverse order.
Note: Services and KPI panels are sorted by severity from highest to lowest by default. The services with the same severity are sorted by health score from lowest to highest. The KPIs with the same severity are sorted by KPI update time in reverse order.
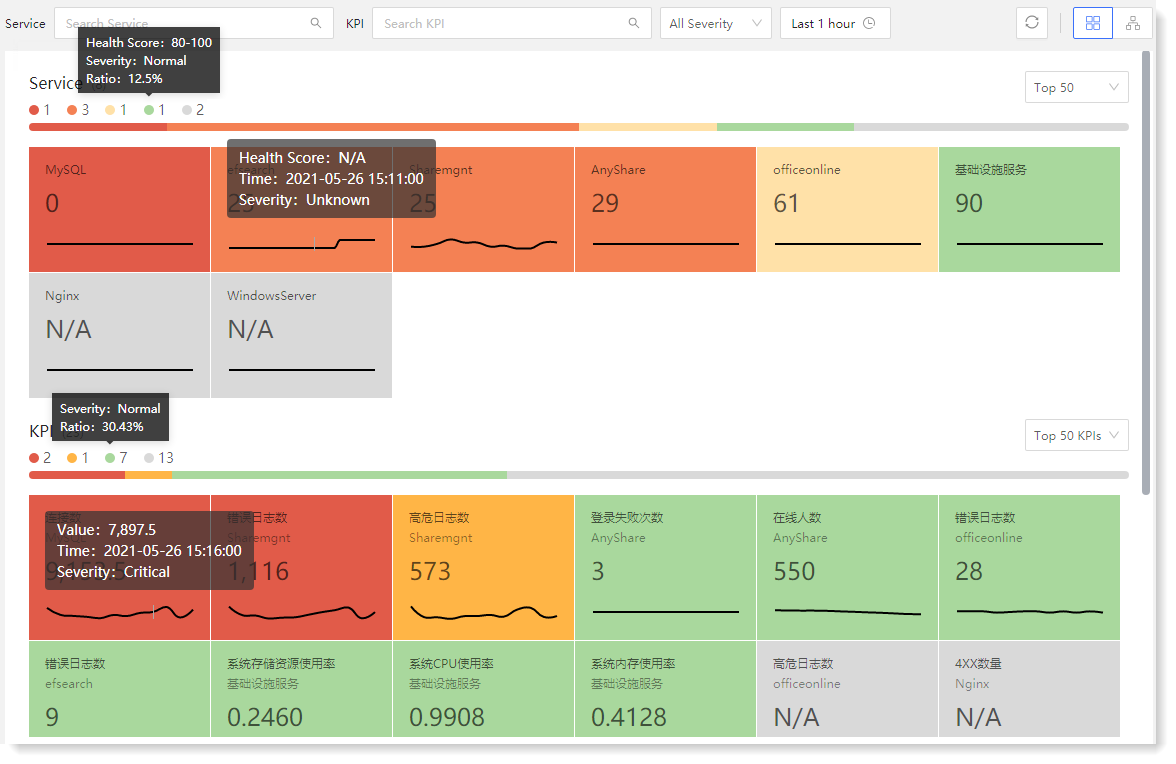
• Pop-up message of details: Hover over the severity mark to view the current severity and severity ratio. Hover over the graph of service or KPI panel to view the health score and KPI aggregation value at a point in time, as follows:
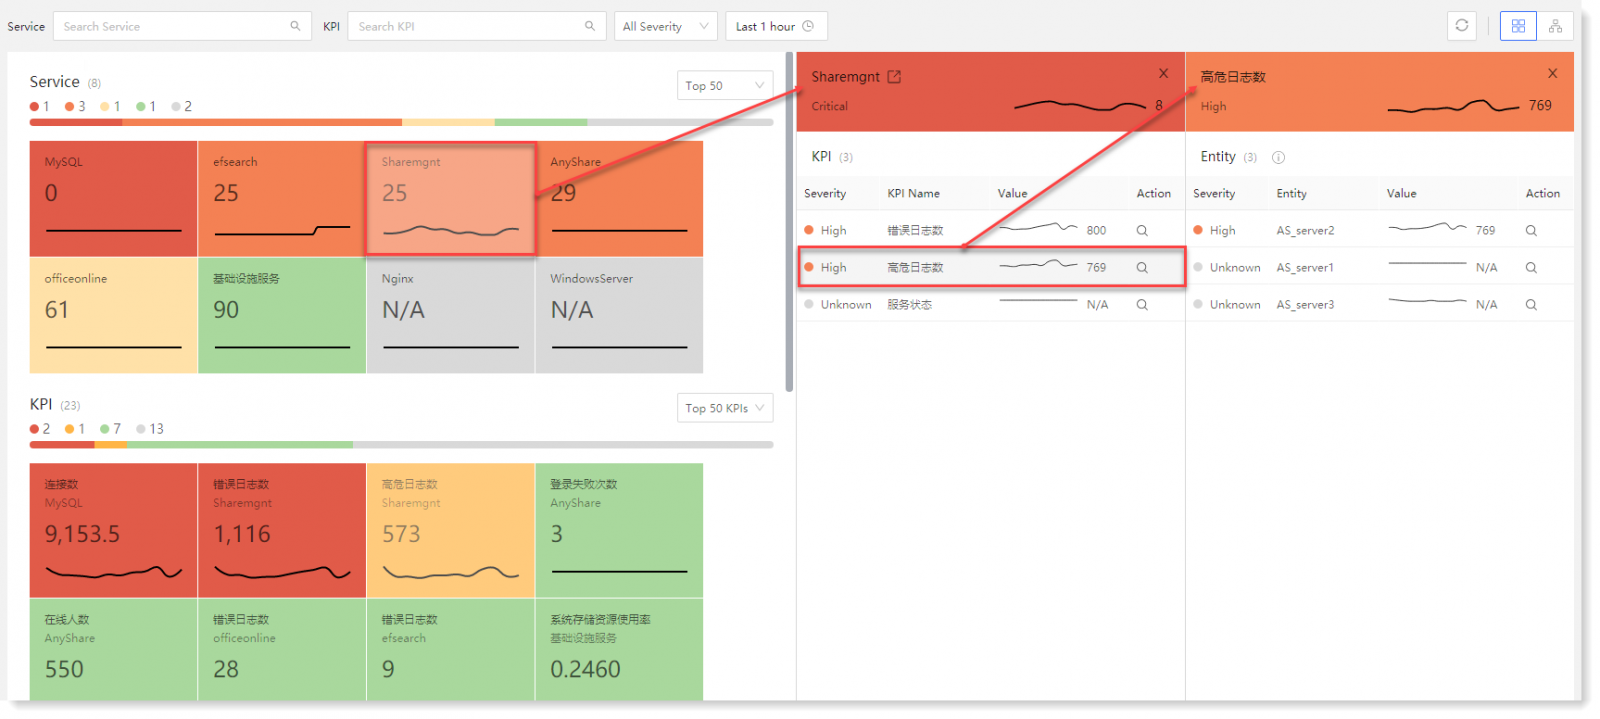
• Drill-down of service/KPI:
For abnormal service or KPI score and severity, you can click on the service or KPI panel to drill down to see if the KPI or entity status is normal, locate the specific anomaly, and drill down for the root cause, as follows:
Note: Click the Jump icon in the upper left corner of the right KPI auxiliary panel to jump to the Services > KPI Configuration, as follows:
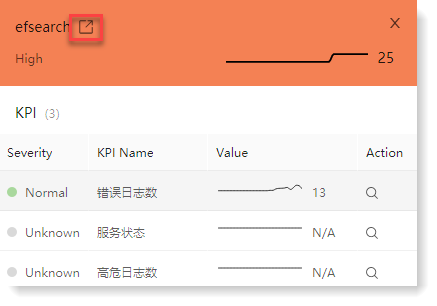
• Original log: It supports the service to drill down to KPI or entity, and click the icon to jump to the search interface and view the corresponding original log data, as follows:
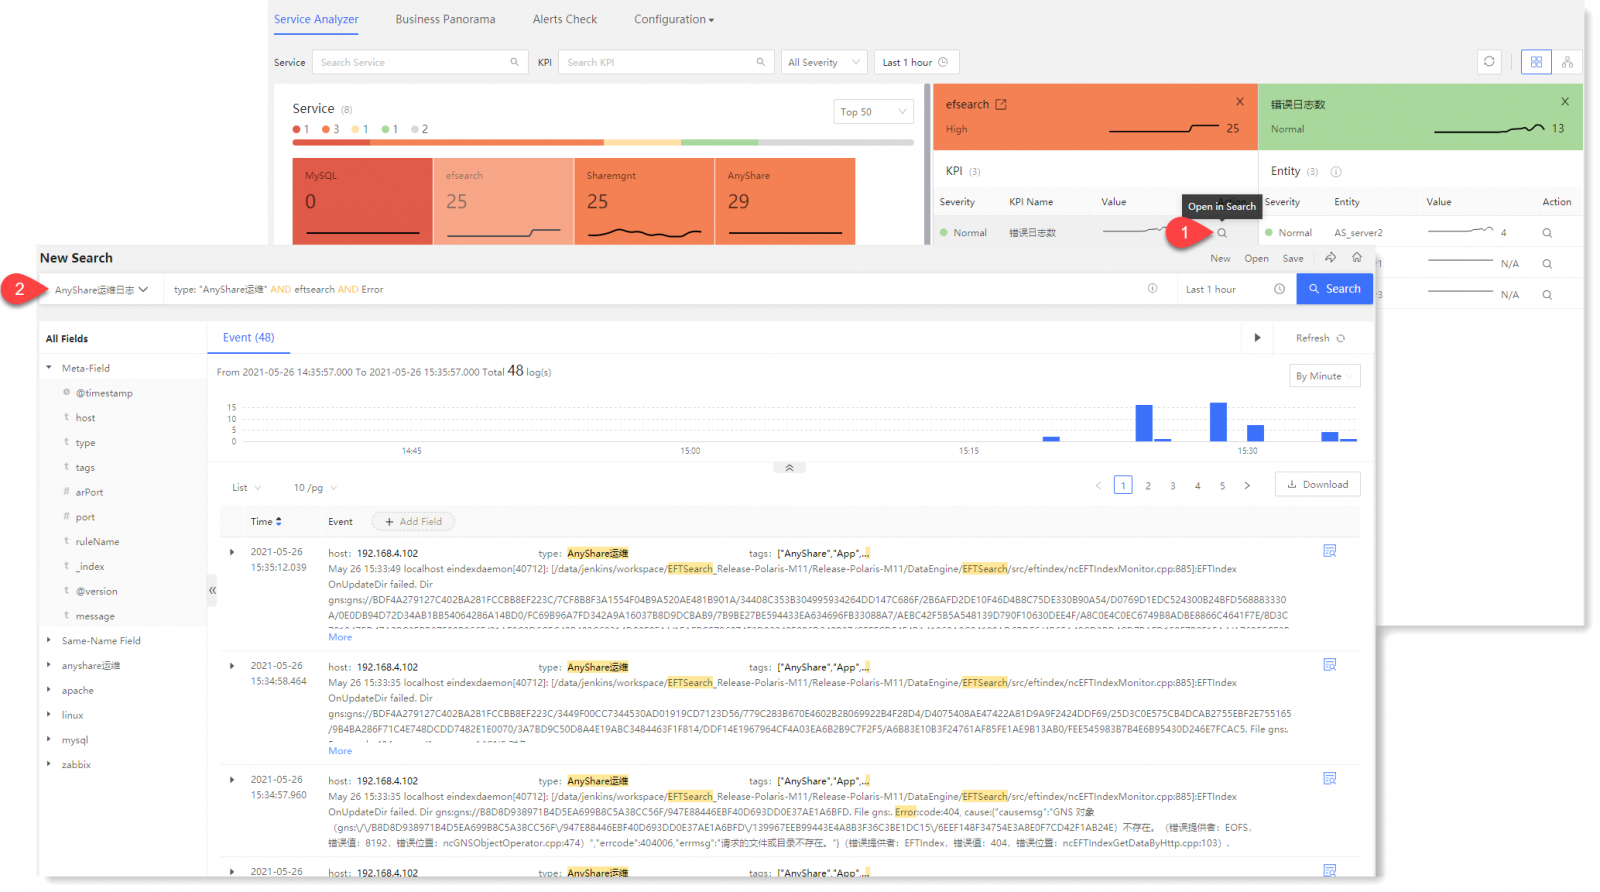
Note: The search results of log are processed according to KPI Data Source, Entity Match Condition and TimePicker in service analyzer interface.
• Service/KPI filter display: It supports filter display by severity, service name or KPI name. It also supports TimePicker search to view the service and KPI running status in specified time range.
Note: For filter by service or KPI name, the KPI corresponding to this service or the service corresponding to this KPI will also be filtered and displayed.
If the service configuration has been completed, go directly to the interface of service analyzer tile view, as follows:
In the tile view, the health score and severity of the top 50 services and the top 50 KPIs for the last 1 hour are displayed by default.
• Service panel: It displays the service name, service health score (the result of latest KPI aggregation), and a graph of the service health score over the selected time period. The relation between the service health score and the severity of the service is as follows:
| Service Health Score | Service Severity |
| 0<Service Health Score ≤20 |  Critical Critical |
| 20<Service Health Score ≤40 |  High High |
| 40<Service Health Score ≤60 |  Medium Medium |
| 60<Service Health Score ≤80 |  Low Low |
| 80<Service Health Score ≤100 |  Normal Normal |
| N/A:It shows unknown if the KPI aggregation result has not yet been available |  Unknow Unknow |
| N/A:The service is disabled |  Disabled Disabled |
• Switch the number of panels displayed: you can set the number of service and KPI panels displayed on the interface according to actual needs, as follows:
Note: Services and KPI panels are sorted by severity from highest to lowest by default. The services with the same severity are sorted by health score from lowest to highest. The KPIs with the same severity are sorted by KPI update time in reverse order.• Pop-up message of details: Hover over the severity mark to view the current severity and severity ratio. Hover over the graph of service or KPI panel to view the health score and KPI aggregation value at a point in time, as follows:
• Drill-down of service/KPI:
For abnormal service or KPI score and severity, you can click on the service or KPI panel to drill down to see if the KPI or entity status is normal, locate the specific anomaly, and drill down for the root cause, as follows:
Note: Click the Jump icon in the upper left corner of the right KPI auxiliary panel to jump to the Services > KPI Configuration, as follows: • Original log: It supports the service to drill down to KPI or entity, and click the
icon to jump to the search interface and view the corresponding original log data, as follows: Note: The search results of log are processed according to KPI Data Source, Entity Match Condition and TimePicker in service analyzer interface. • Service/KPI filter display: It supports filter display by severity, service name or KPI name. It also supports TimePicker search to view the service and KPI running status in specified time range.
Note: For filter by service or KPI name, the KPI corresponding to this service or the service corresponding to this KPI will also be filtered and displayed.
< Previous:
Next: >