


Updated at: 2022-12-09 03:49:50
In the graphic component area on the left side of the New Business Panorama, select the Chart Control - Trend Chart, drag and drop it into the canvas, and the trend chart configuration parameters interface is displayed on the right side, as follows:
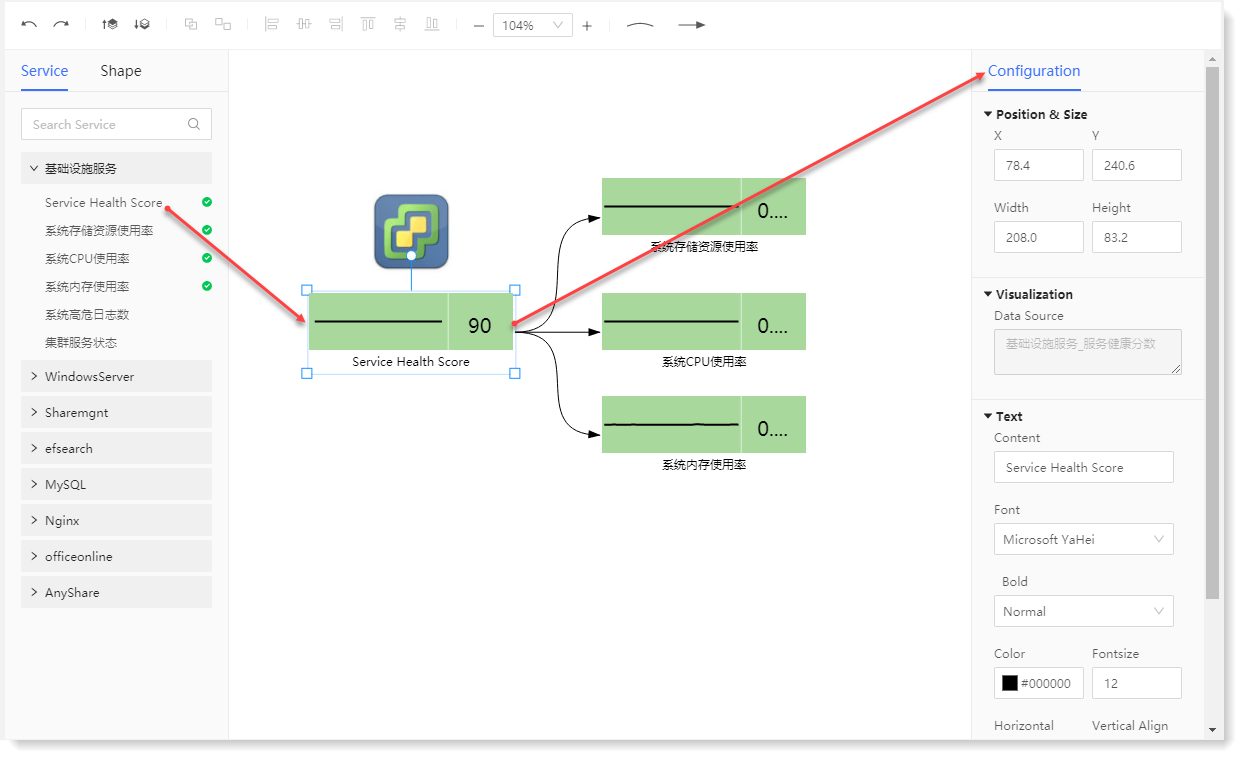 The configuration parameters are as follows:
• Position and Size: The coordinate position (X/Y) and graph size (width/height) for customizing the trend graph;
• Data Source: It is to set the source of the data displayed in the trend graph, by default from the Service;
• Content: It to customize the text displayed below the trend graph;
• Display Settings: The font, size, color, bold, line height and alignment of the text displayed.
_79.png) Note: The added trend graph displays
Note: The added trend graph displays  icons.
The configuration parameters are as follows: • Position and Size: The coordinate position (X/Y) and graph size (width/height) for customizing the trend graph;
• Data Source: It is to set the source of the data displayed in the trend graph, by default from the Service;
• Content: It to customize the text displayed below the trend graph;
• Display Settings: The font, size, color, bold, line height and alignment of the text displayed.
Note: The added trend graph displays icons.
< Previous:
Next: >