System Configuration
› System Security Level Policy
• Security Level
Security level enforces mandatory secrecy constraints, defining collaboration rules between users or access rules between users and documents.
There are three types: System-level, File-level, and User-level, classified into four tiers: Non-Classified, Internal, Confidential, and Secret.
-
-
- System Security Level is for the whole server system, which can be used to mark the highest level of the current system. Only System Admin or Super Admin can set the system security level. The settings of system security levels can only be ascending order, but not vice versa. User Security Level and File Security Level should conform to the settings of System Security level.
- File Security Levels as the fixed attributes of files, cannot be changed even if the file content, file name or location is changed. File Security Levels can be set by file owners.
- User Security Levels cannot be changed even if the user organization is changed. Only Security Admin and Super Admin can set the User Security Levels.
-
Note: System-level ≥ User-level ≥ File-level. Custom naming for security levels (e.g., Non-Classified/Internal/Confidential/Secret) is supported, please consult technical personnel for details.
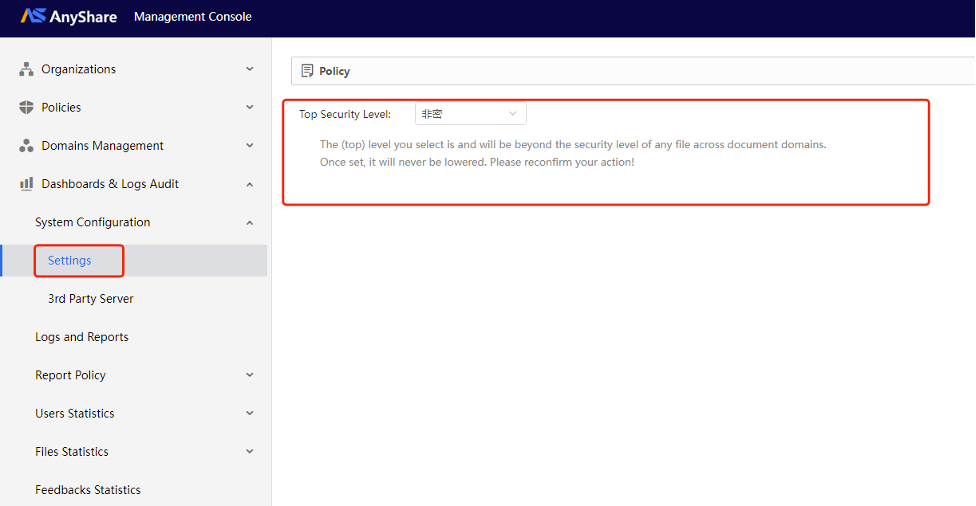
• System Security Level
The system security level represents the maximum secrecy tier for the Doc Domain—no user or file may exceed this threshold. System administrators can configure security levels (Non-Classified, Internal, Confidential, Secret) under [Dashboards & Logs Audit] > [System Configuration] > [Settings].
Note: Once set, it can only be escalated (not downgraded), please proceed with caution.
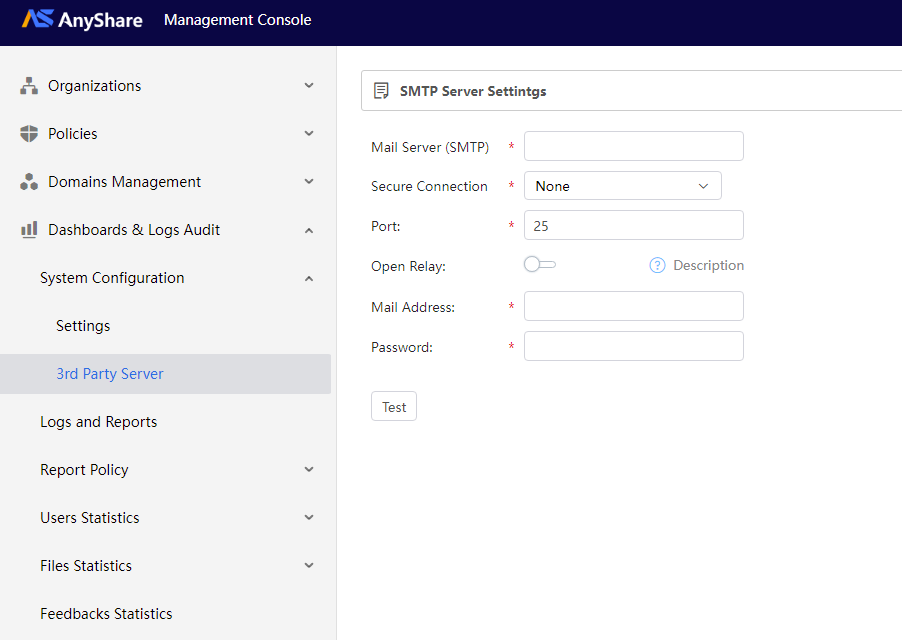
› 3rd Party Server
Configure SMTP server connections under [Dashboards & Logs Audit] > [System Configuration] > [3rd Party Servers] to enable email services (e.g., alert notifications).
Logs and reports
Logs record all system activities and are critical for security audits. AnyShare Management Console allows administrators to audit logs ([Dashboards & Logs Audit] > [Logs and Reports]) and manage report policies ([Dashboards & Logs Audit] > [Report Policy]).
Key Concepts
-
- Log Types:
- Operation Logs: User actions (upload/download/edit/delete/rename/share files).
- Access Logs: Operation records of users logging in/out of the client and admin logging in/out of the console.
- Management Logs: Administrative operations.
- Reports: Tabular collections of business service data.
- Business Groups: Basic units for organizing log reports, containing related services/logs.
- Log Types:
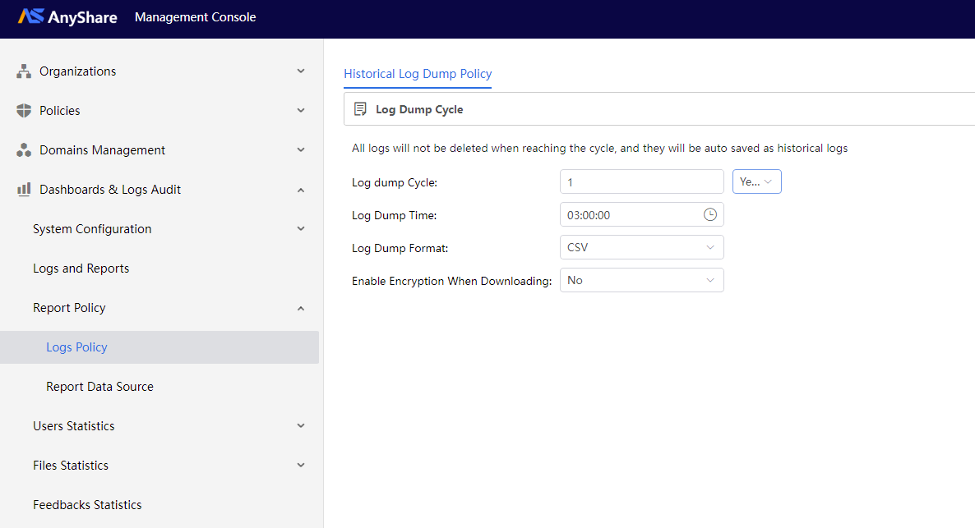
› Report & log policy
• Policy Management
Under [Dashboards & Logs Audit] > [Report Policy] > [Logs Policy], define log dump cycle, time, format, and encryption to configure historical log dump policy. Archived logs are preserved automatically.
• Configure data source
Navigate [Operations & Auditing] > [Report Policy] > [Report Data Source] in Management Console to manage data sources for various report logs. The configuration steps are as follows:
1. Create data source
When using a data source, users must provide a set of configurations to manage it. Click [+Create Data Source] in the upper-left corner to configure.
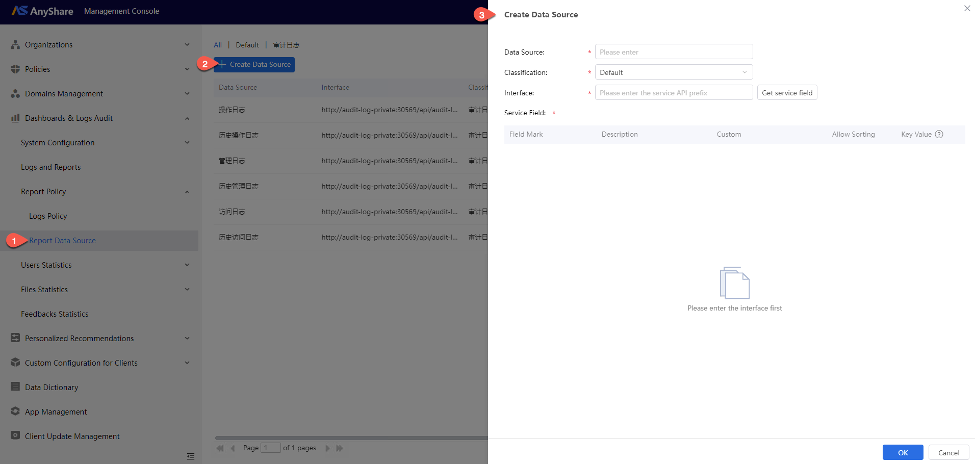
The table below explains each configuration field:
|
Field |
Source |
Description |
|
|
Data Source |
User input |
The name of the data source. |
|
|
Data Source Classification |
Dropdown selection (includes a default category and user-created categories) |
Groups data sources based on user-defined characteristics. Classifications serve as management units, allow users to classify multiple data sources by their specific attributes. For example: Data Source A and B may share authentication mechanisms, or both may be developed and maintained by the same department. |
|
|
Data Source Interface |
User input |
The business service interface connecting to the reporting module. |
|
|
Service Field |
Field Identifier |
Retrieve data through the data source interface. |
Assigned by the business to distinguish fields. |
|
Field Description |
Business-provided title summarizing the field’s purpose. |
||
|
Custom Description |
Editable by users (defaults to Field Description). |
||
|
Sortable |
Whether the field supports sorting in reports. |
||
|
Key Value |
Whether the field supports dropdown searches. |
||
On the Report Data Source management page, users can view a list of data sources.
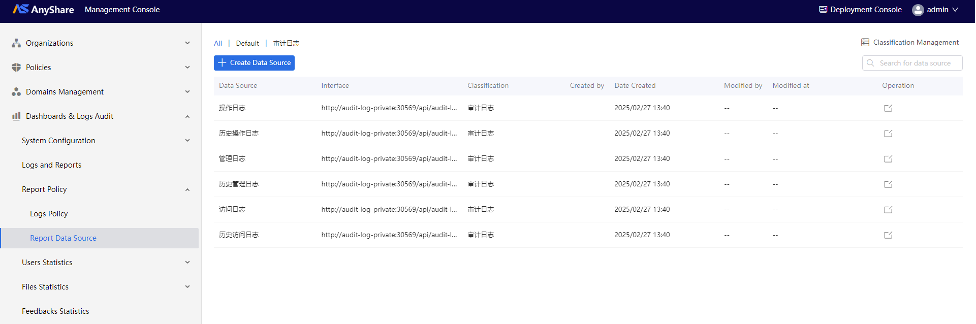
The table below explains each column:
|
Field |
Source |
Description |
|
Data Source Name |
See "Data Source Configuration" above |
|
|
Data Source Interface |
||
|
Data Source Classification |
||
|
Created by |
User Action |
Username of the creator. |
|
Created at |
When the data source was created. |
|
|
Modified by |
Username of the last modifier. |
|
|
Modified at |
Last modification timestamp. |
|
|
Operation |
Buttons for user operations (edit). |
|
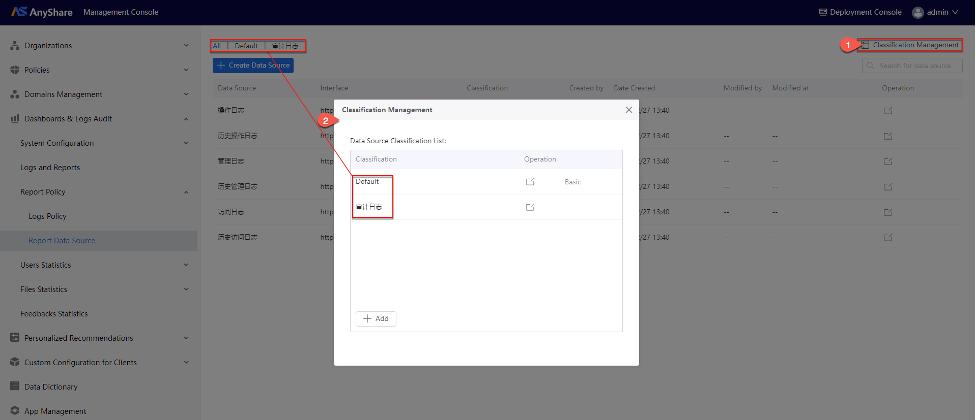
2. Manage data source classifications
› View/Create/Export Log Reports
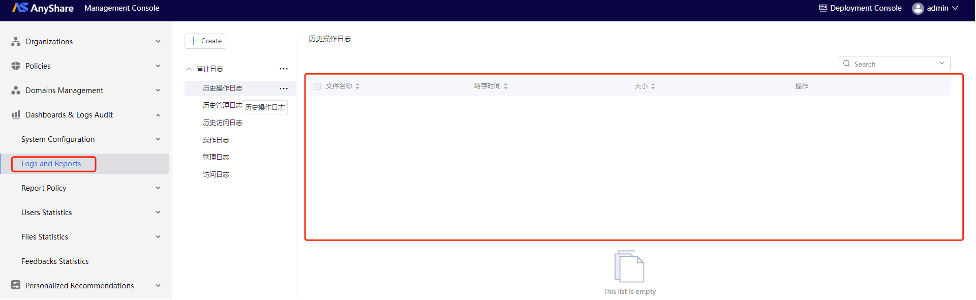
Administrators can access [Dashboards & Logs Audit] > [Logs and Reports] to view, create, export, and manage log reports.
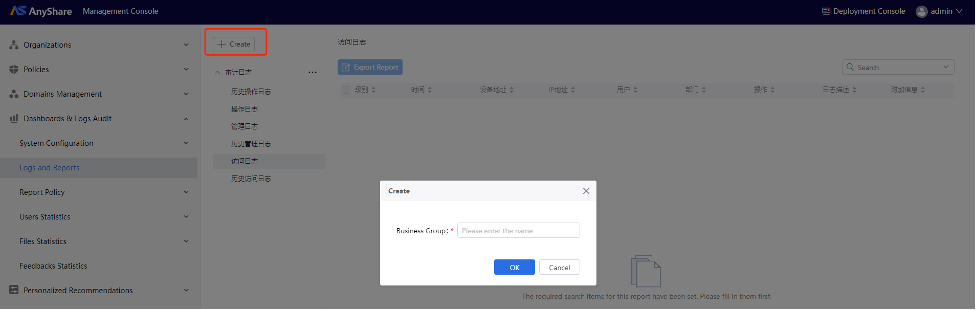
• Assign Business Group
• Create Report
Generate reports using configured data sources (log types). During creation, configure report name, affiliated business group, data source, displayed field, file format (CSV, XML), search item(mandatory/optional) and encryption settings (Yes or No).
Note: If a search item is marked mandatory, users must configure it before viewing the report.
• View log reports
Created reports are displayed in the management interface.
Note: Active logs require start/end time selection.
The log list displays the following information: Level, Device Address, IP Address, User, Operation Type, Log Description, and Additional Info.
Additional information can be viewed by clicking the dropdown arrow preceding each log entry, while other details like Level are directly visible in the active log list.
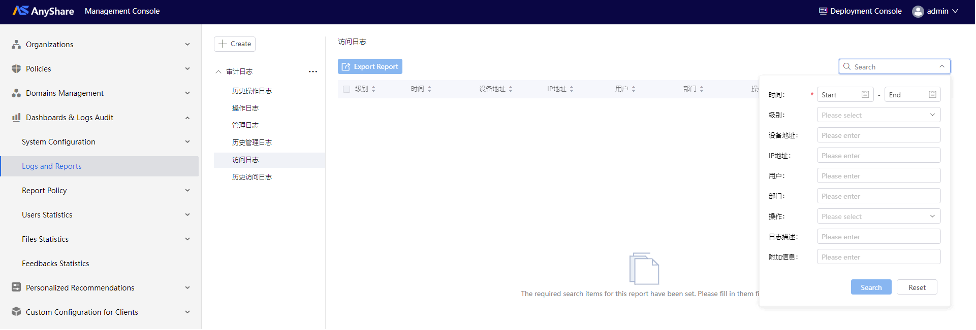
• Log Search
Each active log list supports keyword searching. Administrators can enter keywords in the search bar, select search scope from the following supported fields: Level, Device Address, IP Address, User, Operation Type, Log Description, Additional Information.
• Export Report
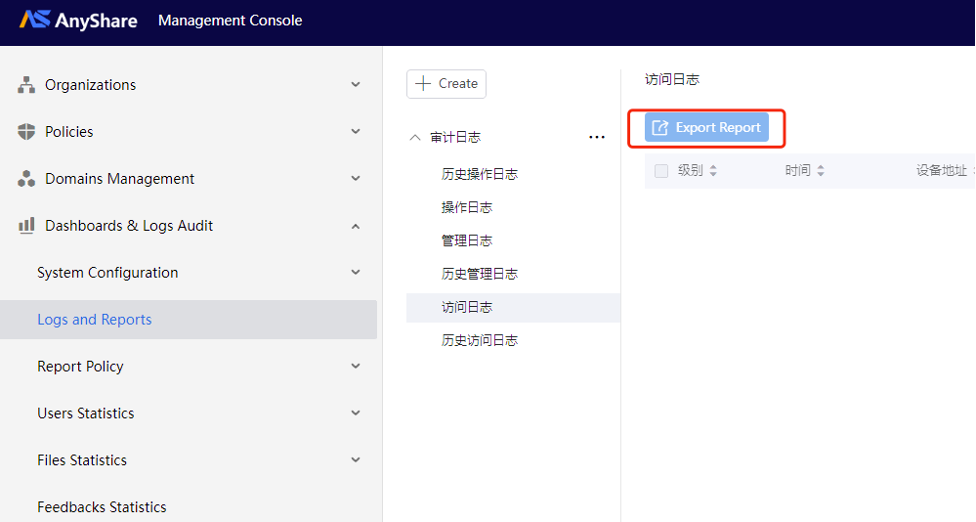
Note: Export is disabled when no logs are displayed.
User Statistics
This module provides statistical data on client active users and online users, with the following features:
› Active User Statistics
Enter [Dashboards & Logs Audit] > [User Statistics] > [Active User Statistics], and Administrators can:
-
- Switch between statistical periods
- View active user counts for selected timeframes
- Export statistical reports as needed
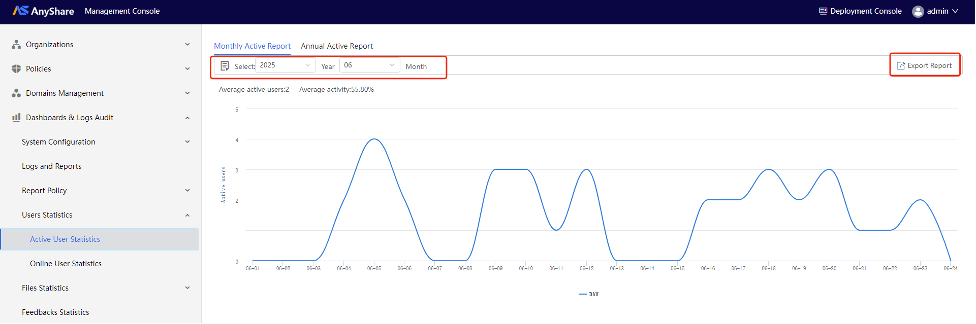
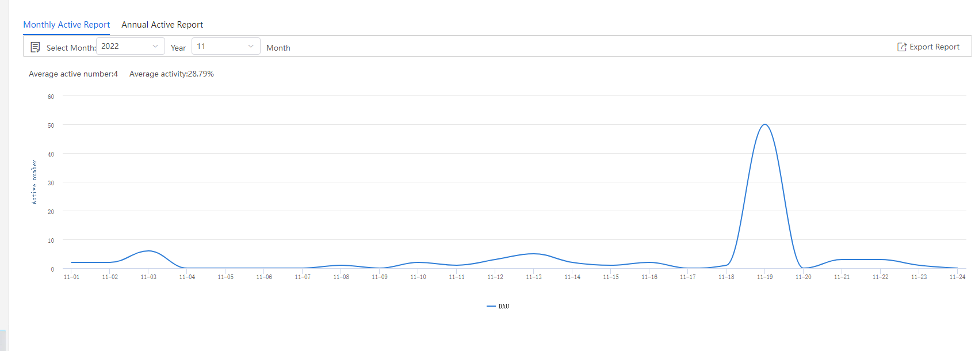
Monthly Active Report:
The Monthly Active Report shows the monthly activeness of organization users. You can view the activeness report in different periods by selecting a date, or month.
Figure-Monthly Active Report
Annual Active Report:
The Annual Active Report shows the monthly activeness of organization users. You can select a specific year to get an annual activity report. If you want to view the monthly report, you can select a month of the year.
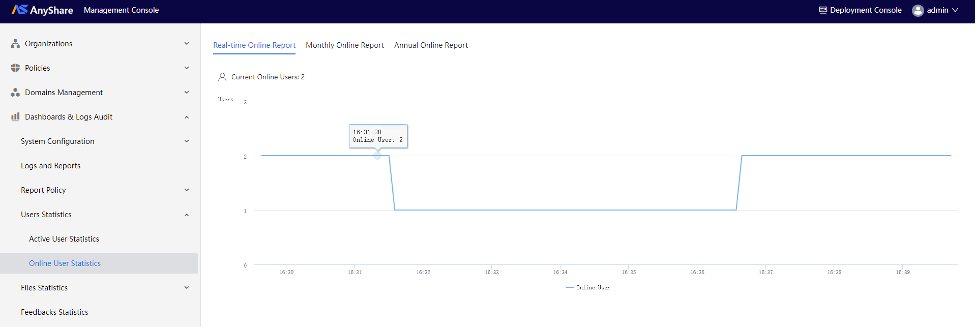
› Online User Statistics
Online User Statistics presents client online user data (real-time/monthly/annual). You can select a time point in the statistics graph to view the online users at a specified time.
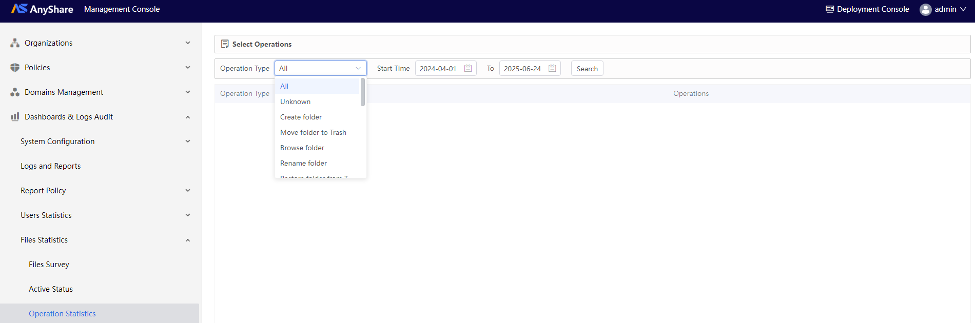
Files Statistics
Tracks file overview and historical statistics, usage, and operation statistics for different file types (e.g., access frequency, edit types), offering administrators a complete view of file activities and utilization patterns.
Figure-File Overview
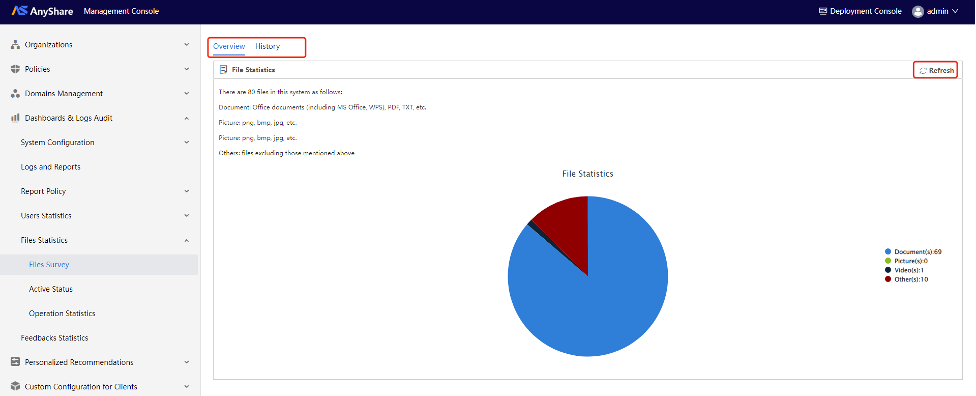
Figure-File Historical Statistics
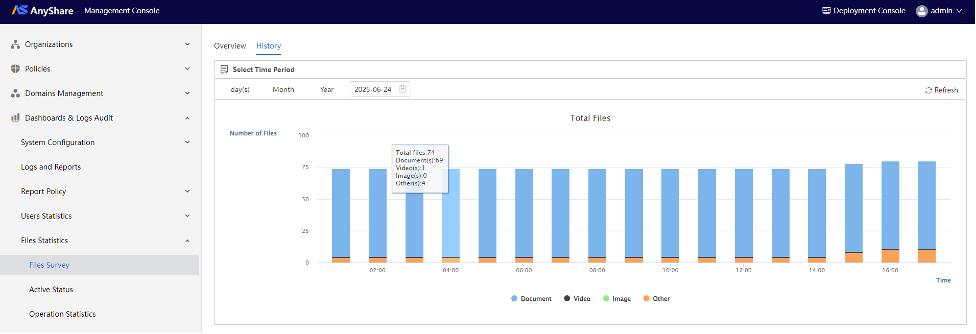
Figure-File Active Status Analytics
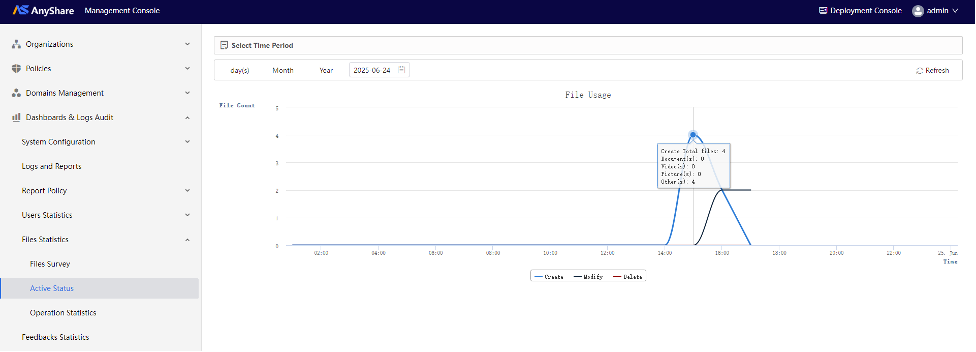
Figure-File Operation Statistics
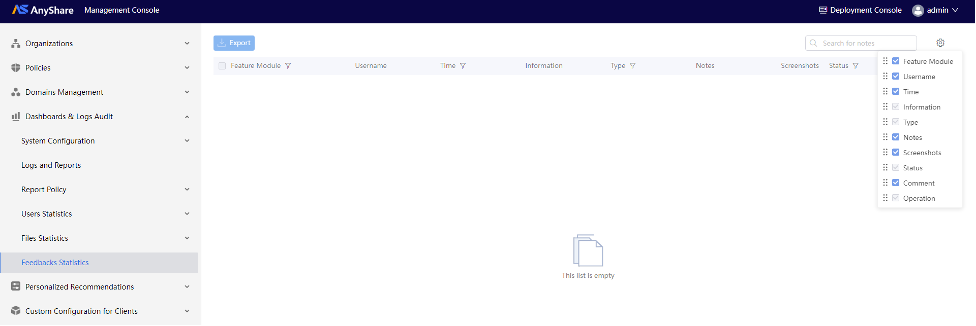
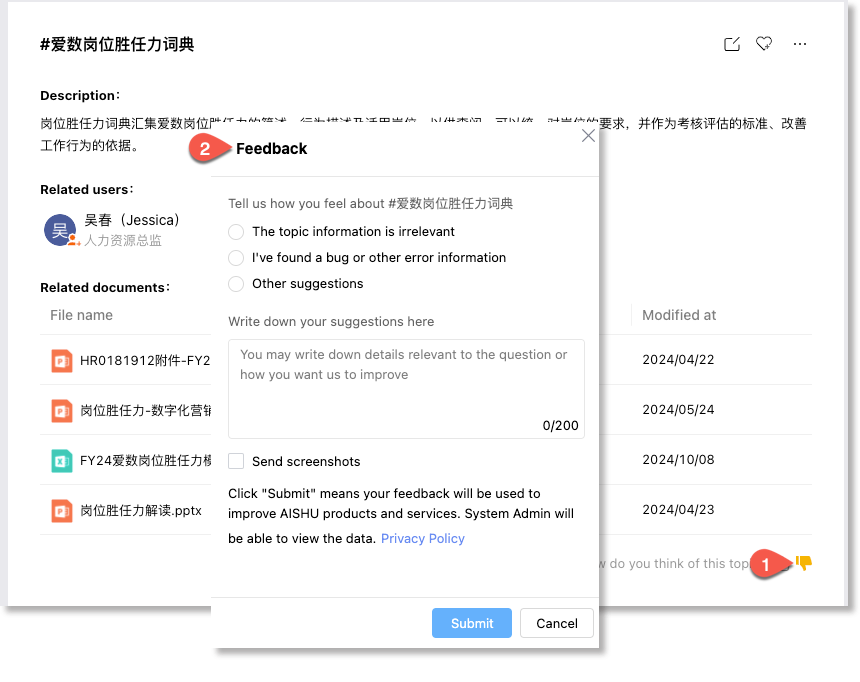
Feedback Statistics
Users can submit feedback on all knowledge content - including intelligent search results, comments, topics, document preview guides, and AI-powered explanations/translations/summaries. Administrators can review and process feedback via [Dashboards & Logs Audit] > [Feedback Statistics] to optimize the knowledge system.
User Feedback Example:
When dissatisfied with Knowledge Topic content, users can click the “![]() ” button below the topic to submit detailed feedback.
” button below the topic to submit detailed feedback.
Figure-Submit specific feedback
Administrators can view all user feedback and take corresponding actions through [Dashboards & Logs Audit] > [Feedback Statistics] in the Management Console.
Figure-Handle the feedbacks